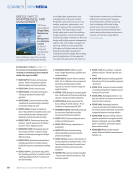
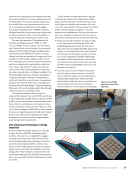
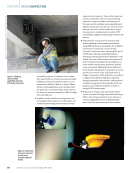
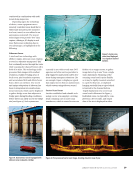
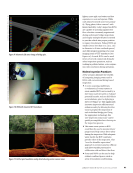
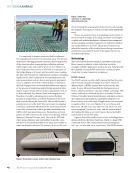
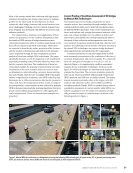
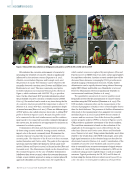
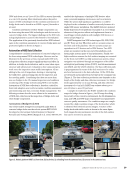
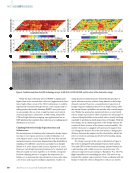
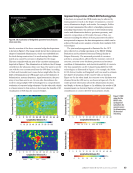
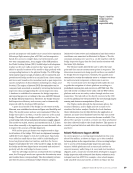
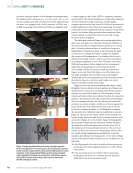
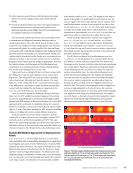
conducted in combination with tradi- tional diving inspection. Depending upon the technology of choice, sonar equipment uses a remotely controlled sonar head that is either hard-mounted, pole-mounted in a boat, towed, or even affixed to an autonomous watercraft. The newest technologies even provide “live” data capture, offering a 3D display in real time. Each sonar technology has its own advantages, as highlighted in the following. Sidescan Sonar A tried-and-true technology with offshore origins, sidescan sonar employs a towed or otherwise transported “fish” that continually moves through the water while scanning the channel bottom off to both of its sides. This technology yields processed data images with excellent resolution, readily revealing areas of local scour, pier foundation exposure, and accumulated drift and debris better than a diver can envision. One recent and unique adaptation of sidescan has been its integration into small autono- mous watercraft, which can be deployed to gather bridge scour data adjacent to bridge piers during flooding conditions, before divers can safely access the bridge site (see Figure 4). Such systems are currently in use with several state DOT agencies and other service providers to help engineers make public safety deci- sions during emergency situations. (As an example, Figure 13 displays a typical data output screen from an autonomous vehicle system using sidescan sonar.) Sector-Scan Sonar Another established and valuable tech- nology, sector scan employs a rotating head containing one or more sonar transducers, which is rotated in staccato fashion via a stepper motor, to gather image data of up to 360° from a single static deployment. Mounting of the scanning sonar head is quite flexible, as it may be rigidly mounted, attached to a pole for boat use, or deployed hanging vertically from a tripod which is lowered to the channel bottom. Tripod deployment of a sector-scan sonar head is illustrated in Figure 5. Individual scans can typically be com- pleted in a few seconds, and output data of the site is displayed in either Figure 4. Autonomous vessel equipped with sidescan sonar evaluates a bridge. Figure 5. Sector scan sonar head deployed in a tripod on channel bottom. Figure 6. Post-processed sector scan image, showing elevation view of pier. J A N U A R Y 2 0 2 3 • M AT E R I A L S E V A L U AT I O N 39 2301 ME Jan New.indd 39 12/20/22 8:15 AM COURTESY: BRIAN ABBOTT COURTESY: HYDRONALIX COURTESY: BRIAN ABBOTT

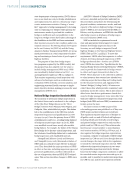
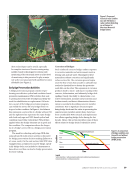
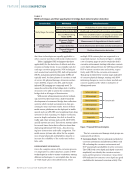
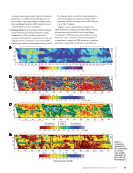
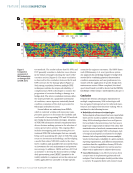
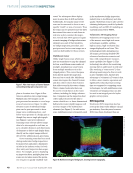
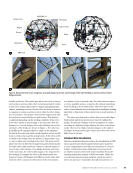
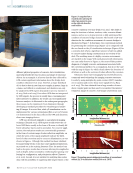
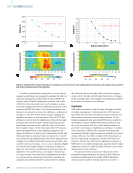
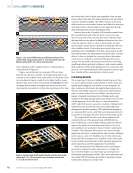
plan or elevation view. Figure 6 illus- trates an elevation view output image. Multiple plan view images can be post-processed as mosaics to cover large areas of concern (see Figure 7), while elevation scans of individual bridge piers can be post-processed to show image views combining above- and below-water portions of a bridge pier as though they were a single photograph (see Figures 6 and 11 for reference). Scanning sonar software allows image data to be interrogated in real time, so as to calculate distances and dimensions of elements or defects and display them directly on the output images without the need for additional post-processing. Sector scanning sonar has been used during underwater bridge inspections for many years and plays a fundamen- tal role in the industry today, for both diver safety and inspection data acqui- sition. For example, prior to deploying an inspection diver, multiple plan view scans can be taken around the perim- eter of a pier to quickly establish “safe zones” for subsequent diver deploy- ment in areas free of drift and debris. Additionally, the angular range of the scan can be narrowed to focus in on a specific “swath” or area of concern. Thus, the sonar can be operated once the diver has entered the water to track them in real time as they conduct the inspec- tion. Several state DOT agencies require acoustic imaging of bridge substructure elements as a part of their underwa- ter bridge inspection procedure, and post-processed sector scan images are a common deliverable for those owners. Multibeam Sonar Unlike single beam sonar, which uses just one transducer to map the channel bottom, a multibeam sonar sends out multiple, simultaneous sonar beams from multiple transducers in a fan- shaped pattern. This covers the space both directly under the inspection boat and out to each side. Multibeam sonars interrogate the channel bottom and also collect returns from features that reflect sound in the water column. Water column backscatter data can be used to reveal objects in the water column, including the bridge substruc- ture. Computers on the inspection boat collect and post-process the data to create colorful two- or three-dimensional bathymetric (water depth) maps as well as sonar images of the substructure elements (see Figure 8). As with sector scan, multibeam sonar is frequently used in the underwater bridge inspection industry due to its efficiency and data quality. Multibeam sonar is also used for obtaining bathymetry used for hydraulic modeling, such as SRH-2D modeling, as currently promoted by FHWA. Volumetric 3D Imaging Sonar Volumetric 3D imaging sonar is one of the newest, most high-tech sonar technologies available, yielding high-accuracy, high-resolution data images displayed in real time. This technology provides instantaneous 3D images, producing detailed GPS- referenced underwater scans in real time, with comprehensive measure- ment capability (see Figure 9). This technology also allows for monitoring moving objects underwater in real time (like watching a “sonar movie”), thus allowing monitoring of a diver at work in zero-visibility water. Another key advantage of volumetric 3D sonar is that it offers a more intuitive operation and significantly reduced post-processing time as compared to competing sonar technologies. As with multibeam sonar, volumetric 3D imaging sonar can also be used as an integral part of a hydro- graphic survey system. ROV Inspection Underwater ROV inspection also has roots in the deep-water offshore oil and gas industry. Over the years, however, ROVs have been developed that are FEATURE | UNDERWATERINSPECTION Figure 7. Plan view mosaic of channel bottom surrounding bridge pier using sector scan. Figure 8. Multibeam image of bridge pier, showing bottom topography. 40 M AT E R I A L S E V A L U AT I O N • J A N U A R Y 2 0 2 3 2301 ME Jan New.indd 40 12/20/22 8:15 AM COURTESY: KONGSBERG MARITIME
ASNT grants non-exclusive, non-transferable license of this material to  .
All rights reserved. © ASNT 2025. To report unauthorized use, contact: customersupport@asnt.org