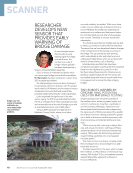
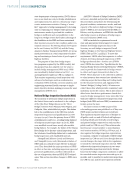
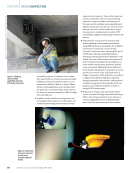
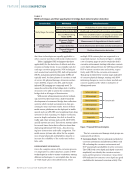
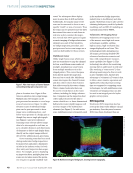
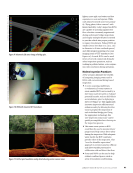
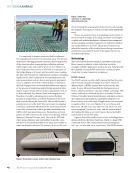
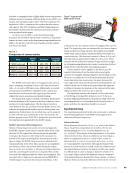
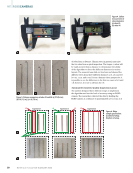
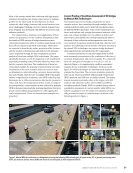
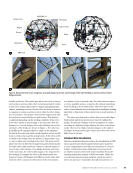
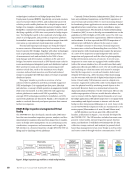
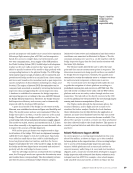
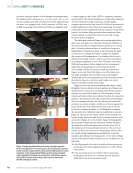
of rebar from a distance. Human eyes, in general, may miss the two sizes from a quick inspection. The longer #3 rebar will be easily noticed from a distance to demonstrate the ability of the algorithm to detect the different diameters in various layouts. The research team laid out two bars and showed the different views from three different distances: 2 ft, 4 ft, and 6 ft (0.6 m, 1.2 m, and 1.8 m). From a human vision perspective, it is possible to see the difference in the first two cases of 2 ft and 4 ft however, it is not so obvious for 6 ft. Automated Geometric Quality Inspection Layout The authors designed three different setups to implement the algorithm and test the level of accuracy using an RGBD camera. The researcher collected the data by holding the RGBD camera at a distance of approximately 4 ft (1.2 m), as it #4 #4 #3 #3#3 Experiment 1 Experiment 2 Experiment 3 Figure 6. Rebar sample specification: (a) sketch of setup (b) photo of setup. ME | RGBDCAMERAS Figure 4. Caliber measurement of rebar diameters: (a) rebar #3 (b) rebar #4. Figure 5. Distance comparison of rebar #3 and #4: (a) 2 ft (0.6 m) (b) 4 ft (1.2 m) (c) 6 ft (1.8 m). #4 #4 #4 #3 #3 #3 50 M AT E R I A L S E V A L U AT I O N • J A N U A R Y 2 0 2 3 2301 ME Jan New.indd 50 12/20/22 8:15 AM

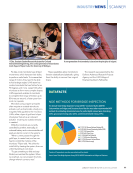
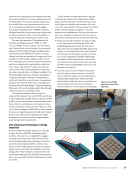
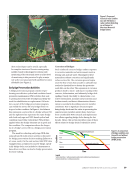
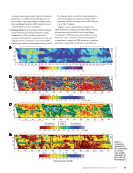
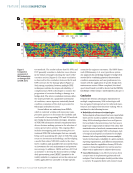
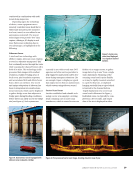
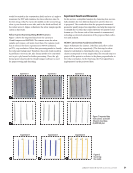
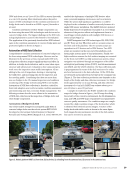
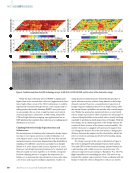
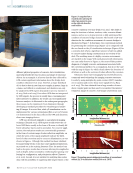
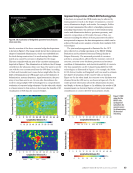
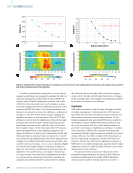
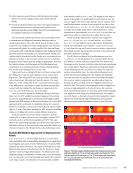
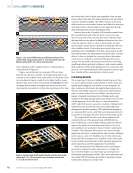
would be carried in the construction field, and at a 45° angle to maximize the FOV and minimize the data collection time. In the first setup, rebar #3 was in the middle in the second setup, rebar #3 was located on one side and in the third and final, all the rebars were #3. Figure 6 illustrates the rebar sample specifi- cation in this study. Rebar Layout Scanning Using RGBD Camera Figure 7 shows the imported data from the camera to CloudCompare and MATLAB. The camera scans the rebar sample and creates a 3D point cloud data. The camera mode that is selected for these experiments is NFOV unbinned, 30 FPS, 720p resolution. Rebar data processing needs to classify the rebar and background. Therefore, the point cloud model in Azure Kinect viewer in the .mkv format needs to be converted out to get a .ply format for further processing. Then, the .ply format point cloud model in CloudCompare software is used for preprocessing and denoising. Experiment Results and Discussion In this section, a simplified analysis by clustering that success- fully classifies the two different diameters used for this test is proposed. The results show that the proposed automated geometric quality inspection algorithm can help the inspector to identify the #3 rebar that could otherwise be missed by the human eye. The future work of this research is summarized, including accelerated automation of the proposed data collec- tion and analysis. RGBD Camera Data Analysis and Results Figure 8 illustrates the clusters. (The blue and yellow colors show rebar #4 and #3, respectively.) The first step for rebar diameter calculation is clustering the data, so a separate cluster corresponds to every single rebar. The second step is to project all the points in a cluster to the plane perpendicular to the rebar orientation. In the third step, the Pratt algorithm is implemented on the projected data. Experiment 1 Experiment 2 Experiment 3 Figure 7. Imported data from camera: (a) model 3D point cloud data (b) MATLAB plot. Figure 8. Clustering the model. Experiment 1 Experiment 2 Experiment 3 #3 #3 #3 #3 #3 #3 J A N U A R Y 2 0 2 3 • M AT E R I A L S E V A L U AT I O N 51 2301 ME Jan New.indd 51 12/20/22 8:15 AM
ASNT grants non-exclusive, non-transferable license of this material to  .
All rights reserved. © ASNT 2026. To report unauthorized use, contact: customersupport@asnt.org