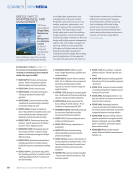
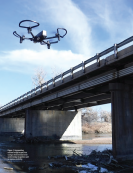
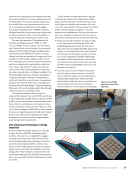
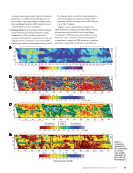
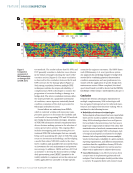
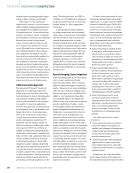
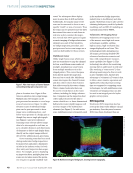
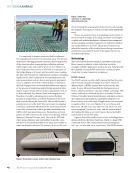
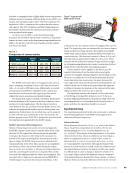
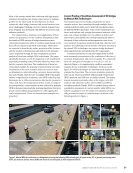
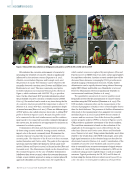
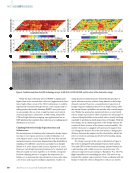
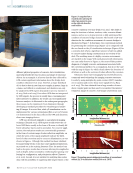
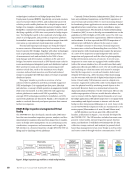
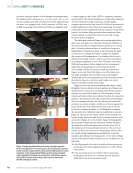
Most of the systems enable data collection with high spatial resolution through the use of large sensor arrays or multiple probes. On the other hand, the development of robotic systems for other bridge elements with vertical surfaces is far more challenging. Climbing robots for vertical elements have been designed and developed with different locomotion and adhesion methods. The characteristics, challenges, and applications of these systems are presented. On the condition interpretation side, the results of NDE surveys of bridge elements are most commonly presented in terms of condition maps based on the data collected by particular NDE technologies. While those are essential to describe the surface projection of the location and the severity of deterioration and defects, both elements can be improved through 3D data visualization and joint analysis of data from multiple NDE technologies. The paper specifically discusses recent developments in 3D visualization of ground penetrating radar (GPR) and ultrasonic shear wave data for concrete structures. The combination of these two technologies enables the mapping of reinforcement and clear visualization of the most common defects in concrete such as delamination, rebar debonding, corrosion, honeycombing, and such. Finally, while the use of multiple NDE technologies enables comprehensive evaluation, each NDE technology has limitations due to different parameters affecting the measured values and, thus, the interpretation of their results. To improve the interpretation, a joint analysis of data collected by multiple NDE techniques using machine-learning algorithms that incor- porate various influencing parameters or other approaches can be implemented. These are discussed and examples are presented. Current Practice of Condition Assessment of RC Bridges by Manual NDE Technologies Deterioration processes in bridge components are often complex and are, thus, manifested through multiple deteri- oration indicators which can be detected and characterized by different NDE technologies. Some of the technologies can detect and evaluate only a single deterioration indicator, while some can evaluate multiple ones. In addition to defect and deterioration detectability, the methods significantly differ in the speed of data collection and interpretation, ease of use, cost, and level of expertise needed in both data collection and analysis. The following sections describe condition assessment by manual NDE technologies on concrete bridge decks and other superstructure and substructure RC components. Condition assessment of concrete bridge decks by NDE most commonly concentrates on the evaluation of the state of corrosion, delamination, and concrete quality. It is commonly done on a test grid, for example, 60 × 60 cm (2 × 2 ft), as shown in Figure 1. A comprehensive condition assessment requires the use of multiple technologies. As shown in the figure, five NDE technologies are simultaneously deployed to evaluate the three states. The corrosion evaluation primarily relies on the electrical resistivity (ER) and half-cell potential (HCP) methods, and GPR as a secondary method. The delam- ination assessment primarily relies on the impact echo (IE) method, with ultrasonic surface waves (USW) and GPR as secondary methods. Finally, USW is a method that provides a quantitative assessment of concrete quality, while GPR is con- sidered a qualitative tool. The results of evaluations are typi- cally presented in terms of condition maps, as shown in the following section in Figure 4. IE IE ER ER HCP HCP GPR GPR USW USW Figure 1. Manual NDE data collection on a bridge deck (a) using the following NDE technologies: (b) impact echo (IE) (c) ground penetrating radar (GPR) (d) ultrasonic surface waves (USW) and electrical resistivity (ER) (e) half-cell potential (HCP). J A N U A R Y 2 0 2 3 • M AT E R I A L S E V A L U AT I O N 57 2301 ME Jan New.indd 57 12/20/22 8:15 AM

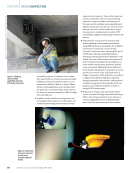
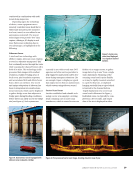
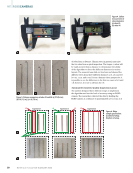
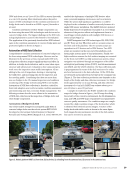
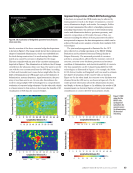
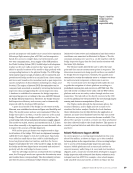
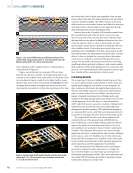
ER evaluates the corrosive environment of concrete by measuring the resistivity of concrete, which is significantly influenced by the moisture content (Nguyen et al. 2017), chloride concentration (Rupnow and Icenogle 2012), and the presence of cracks. The resistance can be related to the normally observed corrosion rates (Gowers and Millard 1999 Hornbostel et al. 2013). The most commonly used probe for field evaluation is a four-point Wenner probe, shown in Figure 1, which conforms with AASHTO TP 95-11 specifica- tions. On the other hand, HCP provides information about the probability of active corrosion of reinforcement (ASTM C876-15). The method can be used at any time during the life of a concrete structure provided the temperature is above 2 °C (Elsener et al. 2003). HCP has a maximum penetration depth of around 200 mm (Bien et al. 2007). There are different types of HCP probes, also called reference electrodes. A rolling HCP probe is shown in Figures 1 and 2. Because the probe needs to be connected to the steel reinforcement, and the reinforce- ment needs to be connected to provide continuity throughout the survey area, the method is not appropriate for inclusion in automated or robotic systems. Delamination detection and characterization are primar- ily done using acoustic methods. Among acoustic methods, impact echo is the most commonly used. IE examines the transient response of a plate-like structure subjected to an acoustic pulse. The objective of the IE test is to detect resonant modes (Sansalone and Carino 1989). The peaks in the response spectrum represent either the thickness stretch Lamb wave modes (Gibson and Popovics 2005) or flexural modes (Kee and Gucunski 2016). The delamination depth can be obtained from the resonant frequency. In the case of shallow delamination (shallower than about 50 mm), where the resonant frequency is high, a more reliable approach is using a constant-phase IE approach (Almallah and Gucunski 2019). Air-coupled IE, in which contact sensors are replaced by microphones (Zhu and Popovics 2007) or MEMS (Sun et al. 2018), opens opportunities for rapid data collection. Another acoustic method that will be discussed later, ultrasonic tomography (UST), provides more detailed imaging of delaminated elements. Finally, shallow delamination can be rapidly detected using infrared thermog- raphy (IRT) (Maser and Roddis 1990 Maierhofer et al. 2001). However, delamination detection significantly depends on environmental conditions (Washer et al. 2009). The quantitative assessment of concrete quality is most frequently assessed by the measurement of concrete elastic modulus using the USW method (Nazarian et al. 1994). The USW modulus evaluation relies on the measurement of the velocity of propagation of surface waves of wavelengths shorter than the deck thickness. The presence of shallow delamination often leads to the measurement of an apparent low concrete modulus (Azari et al. 2012). Typical USW devices consist of a source and two receivers. One of the devices, the portable seismic property analyzer (PSPA), is shown in Figures 1 and 2. GPR provides a qualitative assessment of the deck condition. The condition assessment is based on the evaluation of the amplitude of electromagnetic waves reflected from the top rebar layer (Barnes and Trottier 2000 Maser and Bernhardt 2000 Tarussov et al. 2013). Using certain thresholds, most often related to the results from other NDE technologies, areas with high signal attenuation in the obtained map are described as deteriorated concrete (Barnes et al. 2008). Consideration of the variability of concrete cover thickness and concrete conduc- tivity is essential for an accurate assessment of signal attenua- tion (Dinh et al. 2016). Bridge deck evaluation by GPR can be conducted using ground-coupled (Figure 1) and air-coupled antennas. Typical productivity for ER, HCP, and IE data col- lection using the shown devices is about 100 m2 (1000 ft2) on a 60 × 60 cm (2 × 2 ft) test grid. It is about 25 m2 (250 ft2) for ME | NDEOFBRIDGES IE ER HCP GPR USW Figure 2. Manual NDE data collection on bridge piers and girders: (a) GPR (b) ER (c) USW (d) IE (e) HCP. 58 M AT E R I A L S E V A L U AT I O N • J A N U A R Y 2 0 2 3 2301 ME Jan New.indd 58 12/20/22 8:15 AM
ASNT grants non-exclusive, non-transferable license of this material to  .
All rights reserved. © ASNT 2025. To report unauthorized use, contact: customersupport@asnt.org