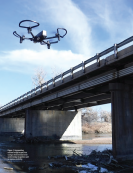
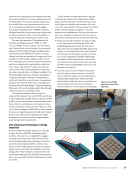
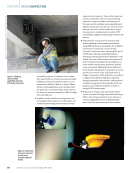
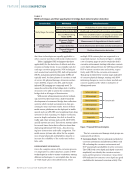
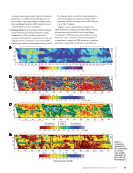
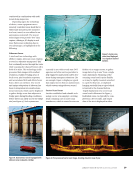
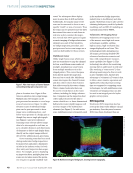
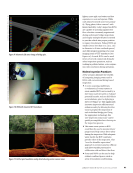
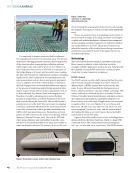
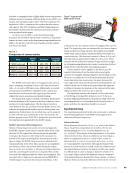
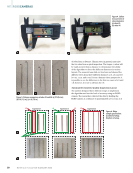
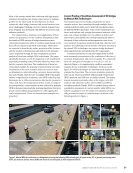
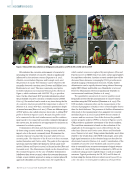
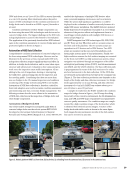
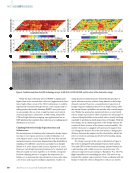
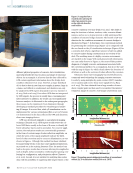
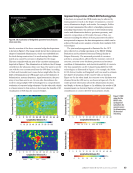
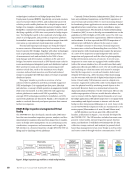
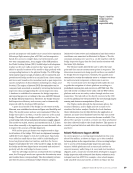
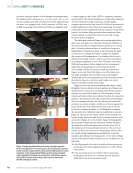
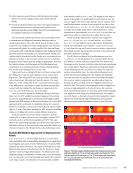
Ñ In the transition period between the flying and traversing modes, the vehicle engages with a girder safely and effi- ciently. Ñ Overall, the hybrid vehicle must have the required payload for measurement devices and structural crawlers to be deployed, and the required flight time for local maintenance or complete inspection of one bridge. The uncrewed multimodal vehicle was successfully tested to demonstrate its flying and traversing functions and its system performance. First, the vehicle as a drone flew to the underside of a simulated wooden bridge girder. Once directly underneath the girder, the vehicle grabbed the bottom flange of the girder with a specifically designed roller clamping system and then traversed the bridge at a constant speed. Finally, the vehicle simply detached from the bridge as it encountered any obstacles and flew to the next area of interest. The overall per- formance of the vehicle met the design requirements. However, the vehicle system could be improved by stiffening several components to avoid any potential vibration during landing that would cause damage (Reven et al. 2019). Figure 3d shows a ceiling UAV that is in direct contact with the ceiling of a room for close-distance ( 10 in. [ 25.4 cm]) inspection. The ceiling UAV is a hexacopter that is installed with a dual-sensor (thermal and optical) camera. The main difference of the ceiling UAV from a conventional hexacopter is the addition of a top frame to make the hexacopter in firm contact with the ceiling. The top frame is composed of two 10 in. (25.4 cm) wide legs 14 in. (35.5 cm) apart. Once in position against the building ceiling as shown in Figure 3d, the UAV enabled consistent imaging of the ceiling at a known standoff distance and thus provided high-quality thermal and RGB images as illustrated in Figure 3d. As the UAV approached the underside of a building ceiling, the required throttle to maintain a certain speed was reduced exponentially (Jiao et al. 2021). Therefore, moving the UAV along the building ceiling or a bridge deck is also energy-efficient in practice. Both the hybrid uncrewed vehicle in Figure 3c and the ceiling UAV in Figure 3d can be used to support various NDE methods, such as active thermography and GPR. The capa- bility of the active thermography and GPR for the detection of subsurface defects is demonstrated using embedded defects in reinforced concrete (RC) bridge decks in the following section. Example NDE Methods Appropriate for Deployment on Robots A 6 × 3.75 ft (1.8 × 1.1 m) RC bridge deck 8 in. (20 cm) thick with embedded defects mimicking delamination in application was designed and cast to test the effectiveness of various NDE methods for defect detection. Two types of delamination with different dimensions embedded into the RC deck were desig- nated as small and large delamination. All delamination was simulated using a combination of foam strips, each measuring 6 in. (15 cm) and 2 in. (5 cm) in length and width. The width of each strip is equal to the thickness of commercially available foam boards, which is 2 in. (5 cm). The length of each strip is equal to the length of a small plastic board, which is 6 in. (15 cm), to support the foam strips during concrete casting. Each small delamination consists of two strips side by side so that its dimension is 6 × 4 in. (15 × 10 cm). Each large delamination is composed of eight strips side by side in pattern to a total dimension of approximately 12 × 10 in. (30.5 × 25 cm) after the gap between the two strips has been taken into account. Small and large delamination objects were supported on 6 × 6 × 5/64 in. (15 × 15 × 0.8 cm) and 12 × 12 × 5/64 in. (30 × 30 × 0.8 cm) plastic boards, respectively. Each plastic board was embedded at two depths, 1.0 and 1.5 in. (2.5 and 3.8 cm) from the top and bottom concrete surface, respectively. This depth scenario represents the concrete cover used in dif- ferent RC members in bridges. The RC deck was heated at the delamination area by a 1 × 4 ft (0.3 × 1.2 m) trip heater for 10 min from both the top and bottom concrete surfaces, respectively. The heater was then removed so the data could be collected for 20 min during the cooling phase. Figures 4a–4d present the infrared images of the delamination area at 20 min of cooling. The concrete surface immediately above the embedded delamination is hotter than its surrounding area. The thicker the delamina- tion, the more the accumulation of heat and thus the higher the concrete surface temperature as indicated in Figure 4a through 4d when cooling inside the Highbay Laboratory at Missouri S&T. The passive thermography under sunlight from a drone at approximately 50 ft (15.2 m) above the concrete deck is presented in Figure 4e. Note that passive thermography was applied to field inspection (Sakagami 2015). In compari- son with Figure 4a through 4d, passive thermography remains effective in detecting the large delamination areas but less effective for the small delamination areas in four RC decks. 1.5 in. cover and 5 mm foam 1.0 in. cover and 5 mm foam 1.5 in. cover and 3 mm foam 1.0 in. cover and 3 mm foam 1.0 in. cover and varying foam thickness Figure 4. Thermal images of delamination with varying concrete covers and foam depths: (a) 1.5 in. (3.8 cm) cover and 5 mm foam (b) 1.5 in. (3.8 cm) cover and 3 mm foam (c) 1 in. (2.5 cm) cover and 5 mm foam (d) 1 in. (2.5 cm) cover and 3 mm foam (e) 1 in. (2.5 cm) cover and varying foam thickness. J A N U A R Y 2 0 2 3 • M AT E R I A L S E V A L U AT I O N 71 2301 ME Jan New.indd 71 12/20/22 8:15 AM

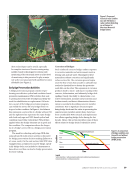
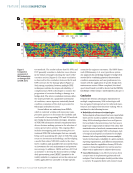
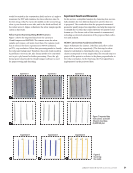
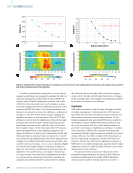
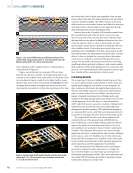
This technology will be implemented in a ceiling drone as demonstrated in Figure 3d. Figures 5a and 5b show two example GPR scan lines from the top side (1 in. concrete cover) and bottom side (1.5 in. concrete cover) of the RC deck, respectively. The locations of the two scan lines in Figures 5a and 5b were aligned well to ensure that the same cross section was scanned and highlighted. Small and large defects (yellow rectangles) and rebar (red dots) loca- tions near the test surface (1 in. from the top side and 1.5 in. from the bottom side) can be clearly seen regardless of the top and bottom sides of the deck. The defects away from the test surface cannot be identified reliably. The GPR is effective in detecting shallow defects or near-surface features and difficult in detecting deep defects due to electromagnetic wave signal loss through thick heterogeneous concrete and shallow rebar. Figure 6 shows the 3D model of GPR results scanned from the top and bottom side of the RC deck. A total of 33 scan lines on each side of the concrete deck were collected. Since the large defects were placed at different elevations (two close to the top and the other two close to the bottom), the alter- nate locations of large defects identified verified that GPR can detect shallow defects. Defects that were buried deep or too small may not be identifiable. Note that a foam strip is not the best representation for delamination associated with corrosion effects it does not include the corrosion objects that makes concrete more conductive and thus GPR signal more atten- uating. The net result is the reduced resolution for detecting small/large defects indicated in Figures 5 and 6 under realistic field conditions. GPR will be implemented on a robot that will move in a two-dimensional plan following predetermined grid- lines. Results will be summarized in a future report. Concluding Remarks The average age of America’s bridges (numbering more than 617 000) is approximately 45 years based on ASCE (2021) and rapidly approaching the end of their 50-year design life. As they continue to deteriorate, the aging bridges require more effective and reliable inspections and more frequent mainte- nance to ensure safety and serviceability. Current practices require a biennial visual inspection of bridges and is only capable of detecting damage when it has advanced to become visually apparent. As a result, there is a rising demand for aNDT and aNDE tools to assess the condition of bridges both qualitatively and quantitively, thus improving bridge asset management decision-making. GPR and infrared imaging as two potential NDE tools in aNDT&E were demonstrated to be successful in detecting subsurface defects in RC bridge decks. The proposed MR interface and robotic platforms will accelerate the use of the proposed app with MR devices, such as HoloLens 2, in the bridge element inspection field to improve the quality of visual inspection (Moore et al. 2001) and condition state assessment for preventative maintenance workflow. The developed MR interface can assist in bridge inspection education, communication, and operative planning in the years to come. The feasibility of a few key robotic plat- forms and NDE techniques to be installed on the robotic plat- forms has been demonstrated for their potential applications in tele-inspection and tele-maintenance in the future. While the potential of the different robotic technologies presented to augment routine inspection is very high, the more involved hands-on in-depth and special inspections still warrant transformative studies. The robotic platforms and associated NDE technologies presented in this paper require further field validations at bridge sites. Figure 5. Line scans of GPR on the top and bottom surfaces of the concrete deck: (a) top surface with 1 in. (2.5 cm) concrete cover (b) bottom surface with 1.5 in. (3.8 cm) concrete cover. Large defect Small defect Rebar Small defect Rebar Figure 6. Isotropic view of GPR results from the concrete deck: (a) top surface with 1 in. (2.5 cm) concrete cover (b) bottom surface with 1.5 in. (3.8 cm) concrete cover. Small defects Large defects Large defects Small defects ME | AERIALNDTFORBRIDGES 72 M AT E R I A L S E V A L U AT I O N • J A N U A R Y 2 0 2 3 2301 ME Jan New.indd 72 12/20/22 8:15 AM
ASNT grants non-exclusive, non-transferable license of this material to  .
All rights reserved. © ASNT 2025. To report unauthorized use, contact: customersupport@asnt.org