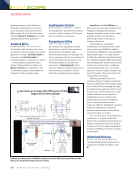
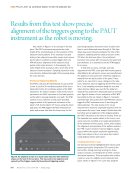
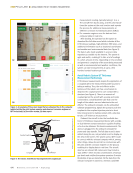
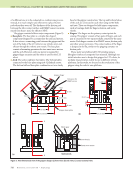
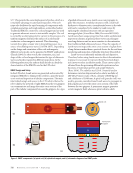
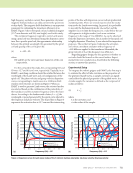
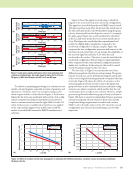
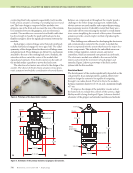
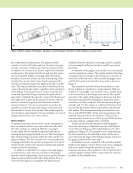
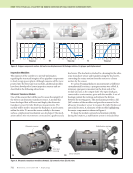
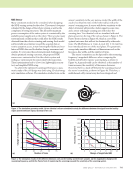
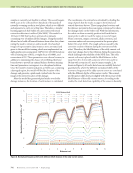
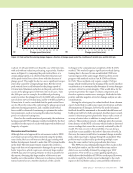
684 M A T E R I A L S E V A L U A T I O N • J U L Y 2 0 2 1 Also shown in Figure 7 is an anomaly in the test piece. The PAUT instrument represents the index length of the anomaly based on the resolution of the ultrasonic beam patterns. If the anomaly is located between two adjacent scan paths, proper index moves by the robot in addition to proper triggers from the PTM will assure alignment of the ultrasonic focal points in the index direction. In this example, the index length of the anomaly is six to seven hits of the ultrasonic beam resolution. Sampling resolution in the scan direction defines the length of the anomaly along the scan direction. Positional Triggering Module The PTM is critical to the dimensional accuracy of the C-scan. It ties the 3D coordinate system of the articu- lated robot to the 2D coordinate system of the PAUT instrument. The system designer must decide how to synchronize the PAUT instrument to the robot position as the robot is moving along the scan path. The PTM used for C-scan collection in this paper provided triggers relative to the positional movement of the robot’s TCP. As the robot’s TCP moves along the robot path plan, the PTM triggers the PAUT instrument to pulse and receive data from the linear array. As the part being inspected becomes thicker, it takes more time to send ultrasound waves through it. This time delay may cause hysteresis between the time of the ultrasonic sampling and the physical location of the TCP when the data was taken. Since hysteresis becomes more severe with increased scan speed and part thickness, it is essential to test the PTM triggers for accuracy. To help test accuracy, coverage, and data alignment of the PTM, a test part with known patterns detectable by the ultrasonic sensor was manufactured. The patterns in the panel were created by milling out material from the back surface of the panel. These patterns are expected to cause changes in the ultra- sonic response. External triggering by the PTM was set for a 2 mm sampling resolution along the scan and index direction. Water was used for the delay line material that couples the ultrasound waves to the test part. Figure 8 shows a C-scan created by a PAUT NDT tool similar to the one shown in Figure 3. Transistor- transistor-logic (TTL) pulses from the PTM were used to trigger the PAUT instrument every 2 mm along the robot path plan. The data shown in the C-scan measured the ultrasonic amplitude response from the array sensor for every 2 mm sample. Results from this test show precise alignment of the triggers going to the PAUT instrument as the robot is moving. There are five separate scan passes shown in the C-scan, and every scan pass recorded an accurate representation of the symmetry of the squares, circles, and triangles. The alignment and symmetry of the patterns assured the PTM created consistent external triggers equally spaced within the system resolution requirements. Edge scans shown in the C-scan were also created using diagonal robotic path plans. Creating the Final C-scan The previous sections highlighted three robotic path planning principles: keeping the TCP normal to the part surface during scanning keeping the Z-axis rotation constant and keeping the Z offset constant during the inspection. These principles were used to create a C-scan of a slightly curved composite test panel, shown in Figure 9. The curve was along the ME FEATURE w automated robotic systems for aerospace ndt Results from this test show precise alignment of the triggers going to the PAUT instrument as the robot is moving. Figure 8. An amplitude C-scan of an acrylic glass test piece with milled-out shapes on the back of the test piece. This was used to test alignment and symmetry of the triggers created by the positional triggering module.

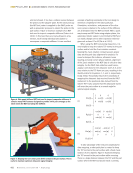
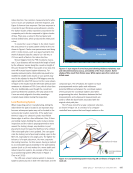
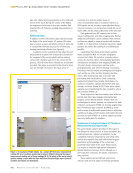
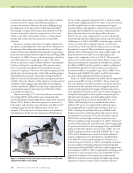
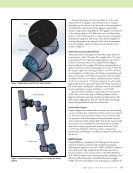
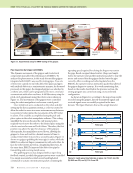
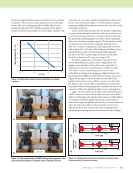
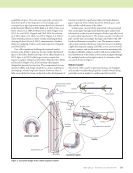
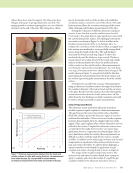
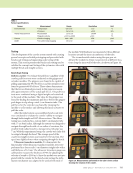
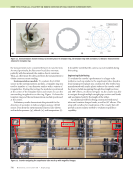
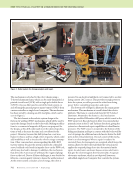
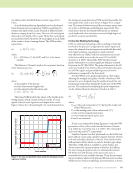
J U L Y 2 0 2 1 • M A T E R I A L S E V A L U A T I O N 685 index direction. Two common measurements for ultra- sonic C-scans are amplitude and time response, and Figure 9 shows a time response. The time response is converted to part thickness using ultrasonic velocity. The darker shades of blue represent areas where the composite part is thicker compared to lighter shades of blue. There was a cutout in this test panel and several drilled holes, which produced the white pixel colors. To create the C-scan in Figure 9, the robot moved the array sensor in a raster pattern similar to the one shown in Figure 6. Twelve scan passes were used along with 11 index moves, each scan pass having 66 mm worth of ultrasonic data for a total of 12 × 66 mm, or 792 mm worth of data in the index direction. Should triggers from the PTM module be inaccu- rate, C-scan distances will not match the length of travel by the ultrasonic sensor along the curved arc length of the part. Should the PTM be inaccurate or too slow, this error will increase beyond system tolerances. For severely contoured parts, robot paths may need to be modified to smaller index moves or scan speeds may need to be adjusted to keep the PTM triggers correctly aligned with the robot TCP moves. For the C-scan shown in Figure 9, the results show the left index (vertical) ruler measures at a distance of 790.5 mm, which is less than 2% error. Additionally, even though the curved test panel had thickness variations, the ramp areas in the C-scan are nicely aligned in the data, revealing a constant Z-axis rotation during the inspection. Local Positioning System When inspecting parts in manufacturing, telling the robot where the part is located is an important step because subsequent parts may not be located in the same precise location every time. If the parts have trimmed edges, the ultrasonic probe must follow these edges to within a few millimeters. Also, if there are tooling clamps holding the parts in place during inspection and the robot is preprogrammed to move around the tooling clamps, any deviation in part placement would increase the likelihood of a collision if the robot path plan is not updated. One can appre- ciate the tooling cost of precisely locating a part in the NDT cell, especially for very large parts. The tighter the tolerance is for part placement, the more expensive the tooling becomes. For this reason, having a method to accommodate typical variability in the part loading system (such as 10 mm) makes for a more stable and robust inspection system. An example of this is the local positioning system (LPS) shown in Figure 1 (Troy et al. 2015). The LPS uses a laser/camera system to measure target locations placed on both the robot base and the composite part. The LPS allows the system to reuse preprogrammed motion paths and addresses potential differences between the coordinate system of the part and the coordinate system used when programming the robot. Deviations between the first measurements and subsequent measurements are used to offset the base frame associated with the original robot path plan. The LPS was tested for a large composite structure, as shown in Figure 10. It consisted of a computer- controlled laser system that read target markers on the 6.5 mm thick 6.5 mm thick 14.5 mm thick Ramp area Ramp area Figure 9. C-scan output of curved test panel showing thickness variations, scan and index dimensional accuracy, and stability of the Z-axis rotation. Darker shades of blue result from thicker areas. White regions were from cutout and drilled areas. Target markers for structure Target markers for robot Local positioning system Z X Y Figure 10. Local positioning system measuring 3D coordinates of targets in the work cell.
ASNT grants non-exclusive, non-transferable license of this material to  .
All rights reserved. © ASNT 2026. To report unauthorized use, contact: customersupport@asnt.org