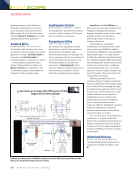
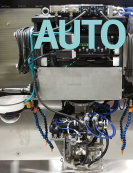
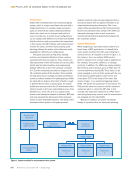
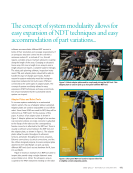
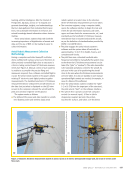
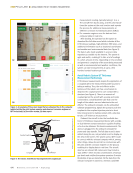
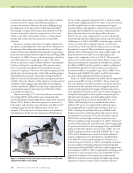
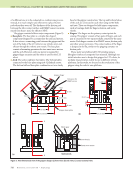
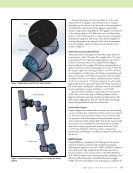
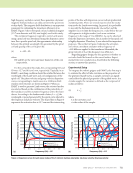
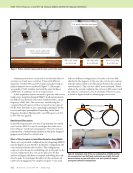
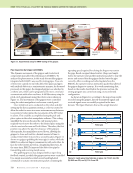
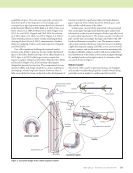
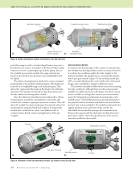
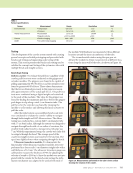
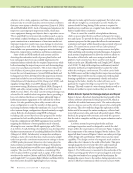
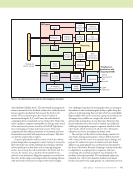
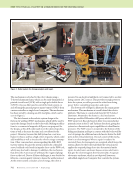
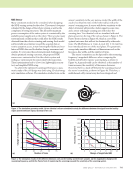
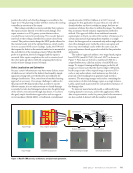
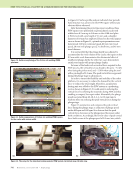
690 M A T E R I A L S E V A L U A T I O N • J U L Y 2 0 2 1 measurement reading, typically taking 1 to 4 s. The aircraft then backs away, and the pilot reposi- tions the system at the next location and repeats the process for additional measurements at different corrosion monitoring locations (CMLs). l The corrosion engineer sees the data on their computer tablet in real time. After landing, the operator has the option to download the full data record which includes all the UT thickness readings, high-definition (HD) video, and additional information such as locational coordinates and weather and environmental data (see Figure 3). The data is also made available in a secure data repository accessible via the Internet. The system is agile and motile, enabling it to take a lot of readings in a short amount of time. Depending on the condition and geometric complexity of the asset being measured as well as environmental and weather conditions, the system can take measurements at up to a few hundred contact locations per hour. Aerial Robotic System UT Thickness Measurement Technology UT thickness measurements require the application of a couplant gel to the measurement probe tip prior to taking a reading. Thus, the end effector at the terminus of the robotic arm has a mechanism to dispense the couplant prior to each contact with a structure (see Figure 4). There is a reservoir of couplant gel on the aircraft with a pump and motor connected to a small-diameter tube that runs the length of the robotic arm and attaches to the end effector. The onboard computer, via the embedded software programming, signals the pump to push the couplant to the couplant injection point at a short time interval prior to making contact with a structure to take a UT thickness measurement. Onboard the aircraft is also the handheld elec- tronic UT thickness measurement device with a single- or dual-element contact transducer capable of taking echo-to-echo ultrasonic thickness measurements. The device is plugged into the onboard computer for power and data transfer. The full data record is trans- mitted during its use, not just what is set to display on the device LED screen. The system uses a Wi-Fi router to connect with the onboard computer which, among other things, allows the aircraft to communicate with the pilot and the corrosion engineer on the ground, enabling it to display data in real time. The aircraft also has an onboard HD camera and may include a “gas sniffer,” which records concentrations of various gas levels and notifies the system operators if certain thresholds of gas are detected. All the data from the onboard computer is saved to a memory card/USB ME FEATURE w aerial robots for ut thickness measurements End effector Robotic arm Stabilizers Contact switch Couplant injection UT probe Figure 4. The robotic end effector that disperses the couplant gel. Figure 3. An example of the screen views that are streamed live to the computer tablets held by the pilot/system operator and observer (corrosion engineer or NDT technician): (a) live video stream (b) data report. (a) (b) Photo credit: ©2020 Apellix, Working Drones Inc. Photo credit: ©2020 Apellix, Working Drones Inc.

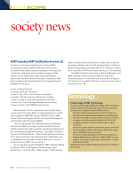
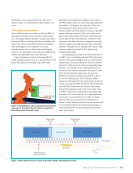
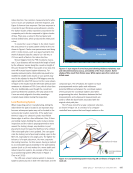
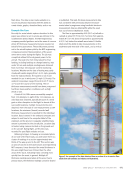
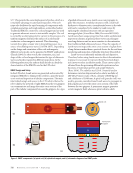
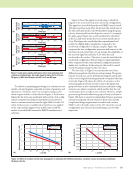
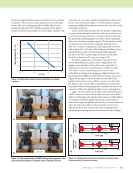
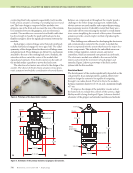
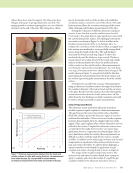
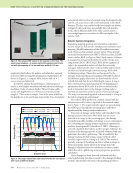
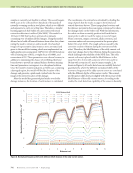
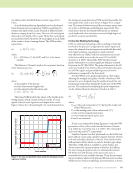
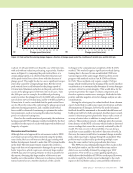
J U L Y 2 0 2 1 • M A T E R I A L S E V A L U A T I O N 691 flash drive. The data is also made available in a secure cloud-based repository with the ability to create charts, graphs, download data, and so on. Example Use Case Recently the aerial robotic system described in this paper was utilized at an in-service gas refinery in the southwestern United States. The NDT engineering company provided guidance as to the areas of concern where UT thickness measurements were required on behalf of the asset owner. These CMLs were pointed out to the aircraft system pilot by the NDT engineering company personnel. Representatives of the asset owner were onsite during the flights. The job was completed without tethered ground power to the aircraft. The total time from initial takeoff to final landing, including landings to change batteries, was under 90 min and multiple readings were obtained from more than 100 separate content monitoring locations. Weather on the date of testing was partly cloudy with winds ranging from 5 to 15 mph, generally from the east/northeast. The system is not recom- mended for use in winds over 20 mph (15 knots). The ambient temperature ranged from 80 to 90 °F (26 to 32 °C) over the course of the morning. The UT thickness measurements would have been postponed had there been weather conditions such as high winds or rain. A total of 104 CMLs were successfully sampled from 112 attempts. In eight of the 112 instances, no valid data was obtained, typically because of a wind gust or other disruption to the flight. In almost all the successful locations, multiple measurements were obtained. From the total of 535 measurements at 104 locations, the minimum (lowest) recorded wall thickness measurement is reported for the individual location. Data is stored in the onboard computer and relayed in real time to the computer tablet of the engineers on the ground. A separate simplified data stream is presented to the aircraft pilot. Location data is tracked using cameras located on the ground and on the aircraft. During flight, an HD video was recorded for post-flight analysis and use. Referring to Figure 5 showing an annotated photo of one side of the flare stack, you will notice there is a cluster of readings in a section approximately two- thirds of the way up and to the left. This section was an area of concern to the asset owner and engineering NDT company. It was theorized the metal thickness in this area might have been thinner than the other areas of the stack, indicating it was corroding more quickly than the asset in general. Multiple UT thickness readings were taken at this area. Due to privacy issues, the thickness readings cannot be shared or published. That said, thickness measurement data was consistent with previously obtained measure- ments taken by engineers using handheld electronic measurement devices utilizing lifts while the asset was out of service (Dahlstrom 2020). The flare is approximately 68 ft (20.7 m) tall with a catwalk at about 55 ft (16.8 m). Sections from approxi- mately 8 ft (2.4 m) above the ground to approximately 4 ft (1.2 m) below the catwalk were tested. A ladder obstructed the ability to take measurements on the southwest and west side of the stack, and a vertical Figure 5. An example of the data obtained from a section of an in-service flare stack (note all numbers and values are illustrative). Photo credit: ©2020 Apellix, Working Drones Inc.
ASNT grants non-exclusive, non-transferable license of this material to  .
All rights reserved. © ASNT 2026. To report unauthorized use, contact: customersupport@asnt.org