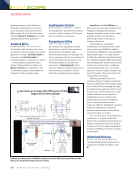
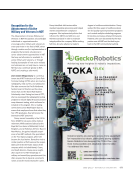
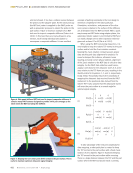
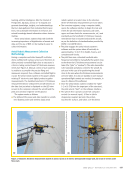
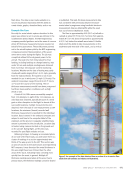
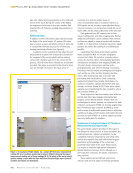
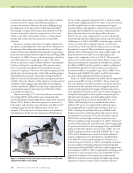
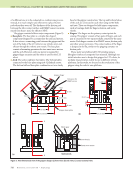
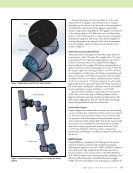
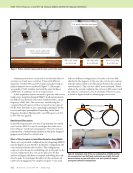
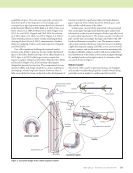
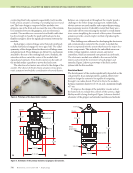
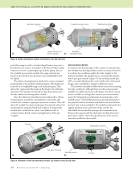
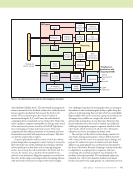
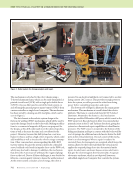
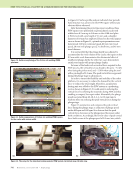
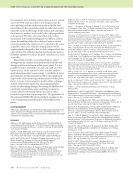
742 M A T E R I A L S E V A L U A T I O N • J U L Y 2 0 2 1 The mechanism is attached to the robot chassis using a T-slotted aluminum frame, which can be easily dismantled. A printed circuit board (PCB) with a single pole double throw (SPDT) relay was fabricated to switch the brush system on and off using the general purpose input/output (GPIO) from a microcontroller or single-board computer. The mechanism has been tested by cleaning an A32 steel plate, which can be seen in Figure 2. The last element in the robotic system design is the friction stir welding (FSW) mechanism, which will be used to repair the damage found on the boiler walls. Making modifica- tions to a commercial magnetic drill press was proposed for the design, as this drill could easily meet the desired specifica- tions as well as decrease the time and cost efforts for the project. However, because this drill system has a cast iron frame, it is heavy and has a high center of gravity, which could add instability as well as increase the robot’s energy consump- tion. Other concerns have arisen regarding the drill’s XYZ traverse system: because the system is driven by a threaded screw, backlash could result in impulse force on the FSW tool, which may also lead to damage. In addition, the mechanism that drives the Z axis may not withstand the required plunge force on the tool. Due to all these challenges, it was decided to fabricate a custom gantry system to house the welder instead. As the entire system consumes a lot of energy, the robot is powered via an electrical umbilical cord connected to an alter- nating current (AC) source. This provides enough power to drive the system, as well as prevent the robot from losing power before completing inspection and repair. The bottom row of Figure 2 illustrates the repair gantry mechanism. This mechanism is towed behind the robotic platform. The frame is constructed from 80/20 T-slotted aluminum. Mounted to the frame is a sled mechanism housing a modified Milwaukee drill press, which is used as the FSW repair tool. Encoded motors drive two perpendicular prismatic joints in the X- and Y-planar directions, giving the system two-dimensional repair capabilities at submillimeter precision. The NDE sensor is mounted to the bottom of the sliding mechanism and kept in contact with the boiler wall by a set of springs. An additional encoded motor drives the drill press in the vertical direction. On each corner of the mecha- nism is an electromagnet. When a repair is ready to be executed, these electromagnets are energized, which keeps the system adhered to the boiler wall while the vertical motor applies the required plunge force into the material under repair. An electronics enclosure houses various electronics that give the electromagnets their functionality. A separate electronics enclosure, which is not depicted, houses an embedded single-board computer that controls the system. ME TECHNICAL PAPER w ai-enabled robotic nde for structural damage RGB depth Embedded AI computing device LiDAR sensor Magnetic track system Cleaned A32 plate Angle grinder Wire brush Vertical plunge motor Robotic platform Repair tool Repair tool NDE probe Electromagnet Electronics enclosure Robot chassis NDE sensor Figure 2. Robot system for damage analysis and repair.

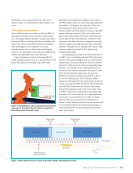
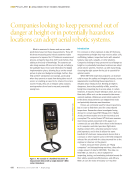
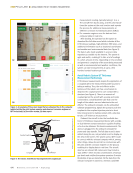
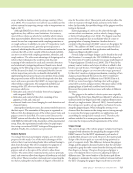
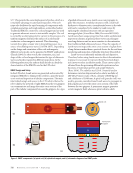
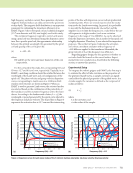
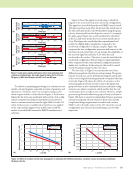
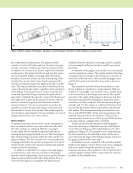
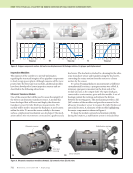
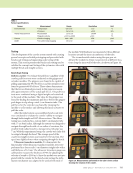
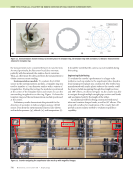
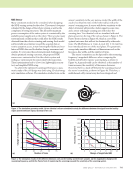
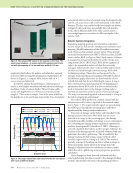
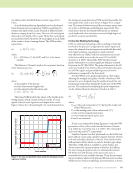
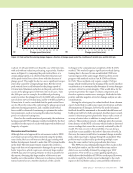
J U L Y 2 0 2 1 • M A T E R I A L S E V A L U A T I O N 743 NDE Sensor Many constraints needed to be considered when designing the NDE sensing system for the robot. The sensor’s footprint is limited by the design of the robotic system as well as the complexity of testing structures. The allowable maximum power consumption of the entire system is constrained by the available power supply unit on the robot. There are also many environmental conditions that could affect the NDE results obtained from the robotic actuating and sensing. Such would add inevitable uncertainties toward the acquired data or restrict actuation access, in turn lowering the fidelity and reso- lution of NDE data used for further damage assessment and analysis. To overcome these aforementioned challenges and obtain optimized sensing outcomes, the proposed NDE sensors were customized to fit in the robotic system and workspace environment for power plant boiler inspection. These optimizations lead to a low-cost, lightweight, noncon- tact, and simplified NDE setup. To achieve the optimized scanning performance, a para- metric study of the coil design was done using 3D electromag- netic simulation software. The simulation studies focus on the sensor’s sensitivity to the very narrow cracks (the width of the crack is less than 0.2 mm) on the boiler wall as well as the sensor’s scanning area. A sensor with better sensitivity to the defect of interest will provide a better signal-to-noise ratio, and a sensor with larger scanning area will reduce the scanning time. Two identical coils are simulated with steel plates present on the top of the coil, as shown in Figure 3. The Pareto front is shown in Figure 3b, which is a set of the optimal outcomes that will not be dominated by other solu- tions. The liftoff distance is 1 mm. A crack (0.1 × 15 mm) has been introduced into one of the steel plates. The parametric sweep study simulates different coil dimensions such as the line space, line width, and the number of turns. The sensor’s sensitivity can be depicted by the resonating frequency’s magnitude difference when comparing the healthy and defective regions’ scanning data, as shown in Figure 4a. A general trend can be observed: as the number of turns increases, the sensitivity of the sensor decreases. However, there is a trade-off between the scanning area and the sensor’s sensitivity, as shown in Figure 4b. Therefore, a multichannel eddy current array has been designed and Gap Width Figure 3. The simulation geometry model: (a) two identical coils are simulated to study the difference between the signal from the healthy region and the defective region (b) detail of the coil. (a) (b) 15 0 2 4 6 8 10 12 0 0 200 400 600 800 1000 1200 1400 2 4 6 8 10 12 20 25 Number of turns Change of magnitude (dB) 30 35 g = 0.2, w = 0.15 g = 0.2, w = 0.3 g = 0.2, w = 0.45 g = 0.4, w = 0.15 g = 0.4, w = 0.3 g = 0.4, w = 0.45 g = 0.2, w = 0.15 g = 0.2, w = 0.3 g = 0.2, w = 0.45 g = 0.4, w = 0.15 g = 0.4, w = 0.3 g = 0.4, w = 0.45 Figure 4. The simulation results of the different-dimension coils on the healthy and defective samples: (a) the magnitudes change at the resonating frequency and (b) the Pareto front of maximizing the scanning area and the sensitivity of the scanning system. (a) (b) Scanning area (mm2) Change of magnitude (dB)
ASNT grants non-exclusive, non-transferable license of this material to  .
All rights reserved. © ASNT 2026. To report unauthorized use, contact: customersupport@asnt.org