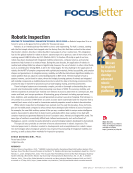
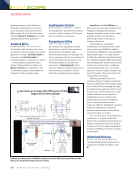
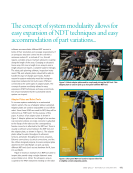
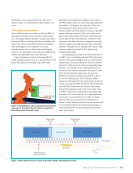
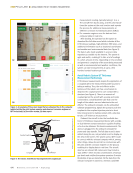
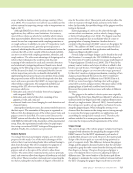
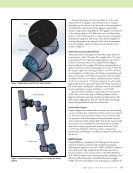
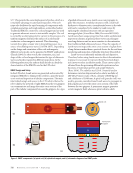
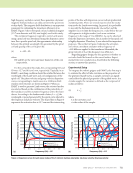
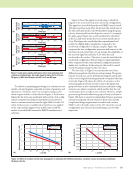
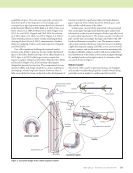
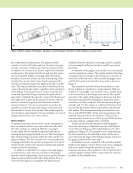
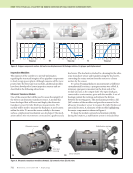
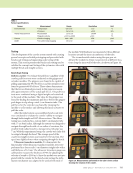
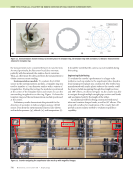
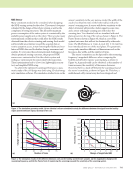
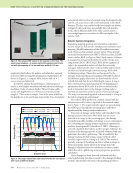
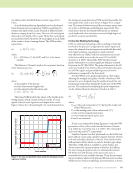
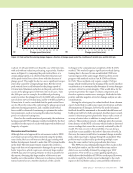
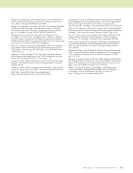
J U L Y 2 0 2 1 • M A T E R I A L S E V A L U A T I O N 743 NDE Sensor Many constraints needed to be considered when designing the NDE sensing system for the robot. The sensor’s footprint is limited by the design of the robotic system as well as the complexity of testing structures. The allowable maximum power consumption of the entire system is constrained by the available power supply unit on the robot. There are also many environmental conditions that could affect the NDE results obtained from the robotic actuating and sensing. Such would add inevitable uncertainties toward the acquired data or restrict actuation access, in turn lowering the fidelity and reso- lution of NDE data used for further damage assessment and analysis. To overcome these aforementioned challenges and obtain optimized sensing outcomes, the proposed NDE sensors were customized to fit in the robotic system and workspace environment for power plant boiler inspection. These optimizations lead to a low-cost, lightweight, noncon- tact, and simplified NDE setup. To achieve the optimized scanning performance, a para- metric study of the coil design was done using 3D electromag- netic simulation software. The simulation studies focus on the sensor’s sensitivity to the very narrow cracks (the width of the crack is less than 0.2 mm) on the boiler wall as well as the sensor’s scanning area. A sensor with better sensitivity to the defect of interest will provide a better signal-to-noise ratio, and a sensor with larger scanning area will reduce the scanning time. Two identical coils are simulated with steel plates present on the top of the coil, as shown in Figure 3. The Pareto front is shown in Figure 3b, which is a set of the optimal outcomes that will not be dominated by other solu- tions. The liftoff distance is 1 mm. A crack (0.1 × 15 mm) has been introduced into one of the steel plates. The parametric sweep study simulates different coil dimensions such as the line space, line width, and the number of turns. The sensor’s sensitivity can be depicted by the resonating frequency’s magnitude difference when comparing the healthy and defective regions’ scanning data, as shown in Figure 4a. A general trend can be observed: as the number of turns increases, the sensitivity of the sensor decreases. However, there is a trade-off between the scanning area and the sensor’s sensitivity, as shown in Figure 4b. Therefore, a multichannel eddy current array has been designed and Gap Width Figure 3. The simulation geometry model: (a) two identical coils are simulated to study the difference between the signal from the healthy region and the defective region (b) detail of the coil. (a) (b) 15 0 2 4 6 8 10 12 0 0 200 400 600 800 1000 1200 1400 2 4 6 8 10 12 20 25 Number of turns Change of magnitude (dB) 30 35 g = 0.2, w = 0.15 g = 0.2, w = 0.3 g = 0.2, w = 0.45 g = 0.4, w = 0.15 g = 0.4, w = 0.3 g = 0.4, w = 0.45 g = 0.2, w = 0.15 g = 0.2, w = 0.3 g = 0.2, w = 0.45 g = 0.4, w = 0.15 g = 0.4, w = 0.3 g = 0.4, w = 0.45 Figure 4. The simulation results of the different-dimension coils on the healthy and defective samples: (a) the magnitudes change at the resonating frequency and (b) the Pareto front of maximizing the scanning area and the sensitivity of the scanning system. (a) (b) Scanning area (mm2) Change of magnitude (dB)

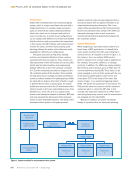
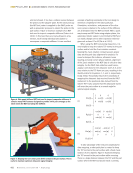
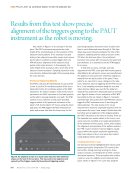
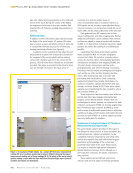
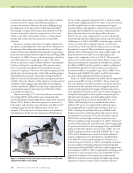
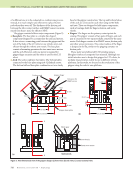
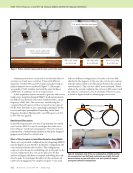
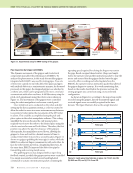
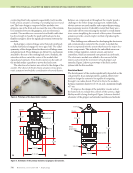
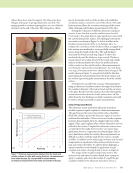
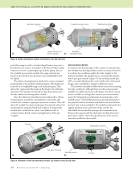
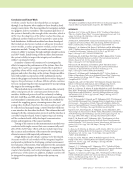
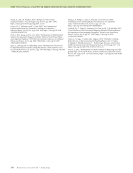
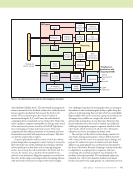
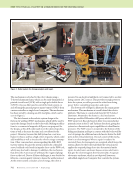
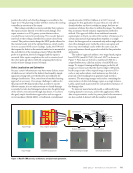
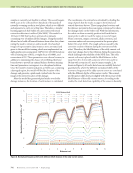
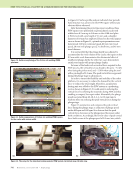
744 M A T E R I A L S E V A L U A T I O N • J U L Y 2 0 2 1 employed, which allows for surface and subsurface anomaly detection while meeting the optimization requirements. As shown in Figure 5, a compact NDE system with a 4 × 2 sensor array was fabricated. In order to validate the performance of the proposed sensor, a steel sample was fabricated with electrical discharge machined cracks of various depths. Three 0.2 mm width cracks with depths from 1 to 3 mm were introduced into sample 1. The cracks on sample 2 are of the same width but the depths are 4, 4.5, and 5 mm, respectively. Two steel plates were placed side by side and scanned using the designed eddy current coil array sensor with a well-maintained 1 mm liftoff distance. The line scan results for the two samples are shown in Figure 6. All cracks were successfully detected quantita- tively, where different shifts of the eddy current sensor’s resonating frequencies correlates to different depths of the narrow crack. Robotic Systems Integration Regarding mapping, position, and orientation estimation, sensory inputs are fed into the simultaneous localization and mapping (SLAM) subsection of the AI-enabled autonomy stack. There are four primary sensory inputs. These include an inertial measurement unit (IMU), wheel encoders, LiDAR sensor, and an RGB (red, green, blue) depth camera. Software is managed via a framework referred to as the robotic oper- ating system (ROS) (ROS 2021). ROS allows segments of code to be organized in nodes such that they are easily managed. Data from the robot’s onboard IMU and its wheel encoders are fused through odometry using a ROS robot localization package. These data are then passed to the Georgia Tech smoothing and mapping (GTSAM) backend SLAM factor graph, where they are fused with the robot’s LiDAR data and data from its RGB depth camera. A map is then constructed and maintained in the 3D mapping and information fusion ROS node. It is also necessary for this node to forward its data to the damage-tracking node to maintain an awareness of the locations of detected damage. The map is continuously updated and maintained in a loop as the robot navigates its environment. The robot’s NDE probe is in constant contact with the infrastructure wall’s surface, depicted as the material under test in Figure 1. The acquired probe signals are passed along the NDE space through the reasoning space until those signals reach the damage analysis subsection. Detection of damage on the boiler wall is handled by the damage analysis subsection. After NDE data are recon- structed as an image in the reasoning space, the damage recognition module classifies each image scan as containing or not containing any damage using a regularized optimization machine learning model (Schmidt et al. 2007). If damage is correctly classified, this leads to another unique challenge: the location of the damage must be accurately estimated and inte- grated into the robot’s global map. This is handled by the damage-tracking module using a unique method called semantic segmentation (Zhang et al. 2018). This method provides a means of classifying an object within an image in terms of its pixels. Given where in the image frame the damage is classified allows for calculation of where it exists within the robot’s global map using a perspective projection calculation. Once damage has been detected and fused with the robot’s global map, the data is passed to the damage-tracking module. This module will instruct the planning module to ME TECHNICAL PAPER w ai-enabled robotic nde for structural damage Mounting holes Data port 4 × 2 sensor array Figure 5. The compact NDE system to be mounted on the robot. The sensor array includes 4 × 2 sensors. Each of the sensors is an 18-turn coil with trace spacing of 0.4 mm and trace width of 0.15 mm. 0 5 3 3.05 3.1 3.15 3.2 3.25 3.3 3.35 3.4 10 Distance (cm) 15 20 25 Gap between two plates 100 mm 8 mm 0.2 mm 0.2 mm 0.2 mm 100 mm 0.2 mm 0.2 mm 0.2 mm 1 mm depth 2 mm depth 3 mm depth 4 mm depth 4.5 mm depth 5 mm depth Figure 6. The single-channel line scan result from the two steel plates with cracks at different depths. Frequency (MHz)
ASNT grants non-exclusive, non-transferable license of this material to  .
All rights reserved. © ASNT 2026. To report unauthorized use, contact: customersupport@asnt.org