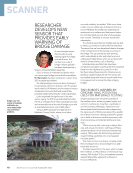
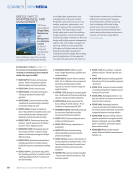
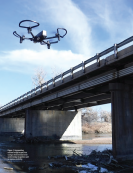
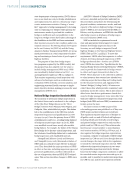
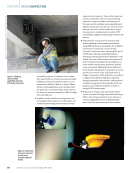
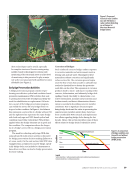
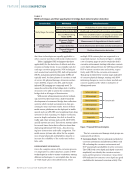
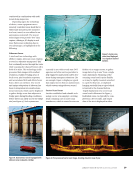
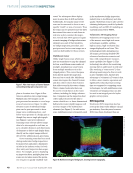
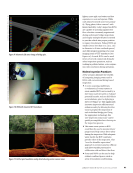
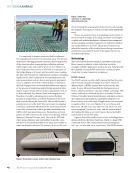
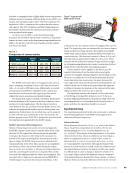
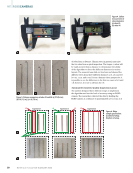
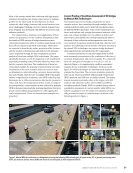
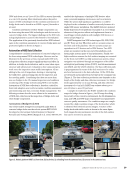
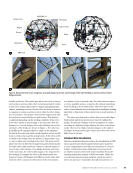
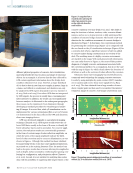
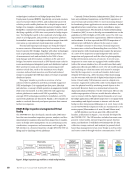
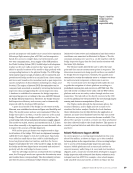
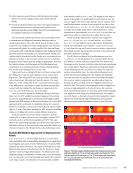
includes a 1-megapixel time of flight depth sensor that provides different modes of scanning. Different fields of view (FOV), res- olution, and operating ranges can be selected to optimize the application. Table 1 summarizes the modes that this camera can support. The FOV, resolution, and functioning range are the features of interest for the automatic geometric measure- ment proposed in this paper. As can be seen in Table 1, as the functioning range increases, the resolution will decrease. However, as long as the camera records a video in the functioning range mentioned in Table 1, the picture would be of good quality and the camera can detect the depth. The RGBD camera also has a 12-megapixel color camera with a maximum resolution of 3840 × 2160 that can be used with 0, 5, 15, and 30 FPS frame rates. Additionally, an inertial measurement unit (IMU) is embedded in the camera that consists of an accelerometer and a gyroscope that can be utilized for sensor orientation and spatial tracking. The mentioned camera contains a developer kit that uses artificial intelligence (AI) sensors to develop computer vision and speech model applications. This developer includes a cross-platform that can read data from the RGBD camera. The software development kit enables users to develop their own applications. Furthermore, the recorded data can be analyzed in other software such as MATLAB. In the next sections, the authors propose to use MATLAB to analyze the 3D point cloud data that has been generated by the RGBD camera. RGBD Camera for Rebar Inspection Instead of visual inspection as the conventional approach, the RGBD camera can be used to scan the entire rebar of the structure. In this regard, the authors present an algorithm to measure the diameter of the rebar in RC structures. So, instead of the inspector doing all the measurements with a tape or caliper, the RGBD camera can be an alternative for visual inspection of the rebar. This can also be accomplished at a distance, which can increase safety during the inspec- tion, as can be seen in Figure 3. The process of data collection starts by connecting the camera to a computer, then a video is recorded by walking around the object and scanning it. The recorded video is imported to software such as MATLAB or CloudCompare to generate the 3D point cloud data. At the construction site, the camera needs to be plugged into a power bank. The inspecting crew can estimate the size/area to inspect based on the power bank capacity. The authors successfully tested using camera using a regular portable power bank at a construction site. The structure consisted of three 16 ft (4.9 m) tall walls with an approximate length of 50 ft (15.2 m). Future research efforts include the testing of longer reinforced cages in civil engineering infrastructure under construction (such as bridge decks, industrial slabs, and parking garages). Further analysis can be applied to the data to get the required information from the rebar before pouring the concrete for example, spacing, diameter, and elevation (cover). However, to estimate the cover from the generated 3D point cloud data before the construction, the space between the outer edge of the rebar and the ground or mold should be cal- culated, which can be done at any point where the inspector is willing to measure the spacing, so the camera and the algo- rithm can detect the cover even if it is uneven. The algorithm measures the diameter of the rebar using a Pratt fitting circle algorithm (Chernov 2022). To have an accurate fitting implementation, all points in single rebar that are perpendicular to its orientation should be projected to a plane, and then the algorithm should be executed. Experimental Setup The experiments presented in the next section aim to evaluate the potential application of an RGBD sensor approach for rebar size placement inspection. Rebar Selection Rebar diameter increases by 1/8 in. (3.175 mm) in the United States. To get the nominal diameter in inches, the bar size should multiply by 1/8 (i.e., #4 rebar diameter is 0.5 in. [4 × 0.125 in.]). The purpose of this experiment is to recognize rebar #3 between four rebars of a different size (#4). Figure 4 shows a comparison between a #3 and #4 bar. #3 and #4 bars are 3/8 in. or 0.375 in. (9.525 mm) and 4/8 in., or 0.5 in. (12.7 mm) diameter, respectively. Although the diameter dif- ference is 33.33% between a #3 and #4, the site conditions and the natural distance between the human and the case makes it a difficult task to catch a change in diameter of only 1/8 in. (3.175 mm). Figure 5 shows the different views in a sequence of increasing distances. Researchers chose a longer #3 rebar to illustrate better and track the differences between the two sizes TA B L E 1 Comparison of camera modes Mode Field of view Resolution Functioning range (m) NFOV unbinned 75 × 65 640 × 576 0.5–3.86 NFOV 2 × 2 binned 75 × 65 320 × 288 0.5–5.46 WFOV unbinned 120 × 120 1024 × 1024 0.25–2.21 WFOV 2 × 2 binned 120 × 120 512 × 512 0.25–2.88 1.5 - 2.5 m Figure 3. Inspector with RGBD camera in hand. J A N U A R Y 2 0 2 3 • M AT E R I A L S E V A L U AT I O N 49 2301 ME Jan New.indd 49 12/20/22 8:15 AM

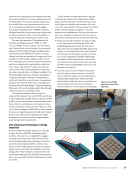
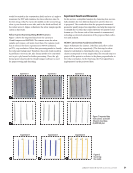
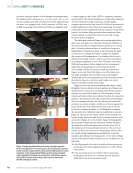
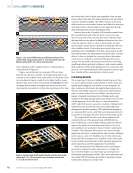
of rebar from a distance. Human eyes, in general, may miss the two sizes from a quick inspection. The longer #3 rebar will be easily noticed from a distance to demonstrate the ability of the algorithm to detect the different diameters in various layouts. The research team laid out two bars and showed the different views from three different distances: 2 ft, 4 ft, and 6 ft (0.6 m, 1.2 m, and 1.8 m). From a human vision perspective, it is possible to see the difference in the first two cases of 2 ft and 4 ft however, it is not so obvious for 6 ft. Automated Geometric Quality Inspection Layout The authors designed three different setups to implement the algorithm and test the level of accuracy using an RGBD camera. The researcher collected the data by holding the RGBD camera at a distance of approximately 4 ft (1.2 m), as it #4 #4 #3 #3#3 Experiment 1 Experiment 2 Experiment 3 Figure 6. Rebar sample specification: (a) sketch of setup (b) photo of setup. ME | RGBDCAMERAS Figure 4. Caliber measurement of rebar diameters: (a) rebar #3 (b) rebar #4. Figure 5. Distance comparison of rebar #3 and #4: (a) 2 ft (0.6 m) (b) 4 ft (1.2 m) (c) 6 ft (1.8 m). #4 #4 #4 #3 #3 #3 50 M AT E R I A L S E V A L U AT I O N • J A N U A R Y 2 0 2 3 2301 ME Jan New.indd 50 12/20/22 8:15 AM
ASNT grants non-exclusive, non-transferable license of this material to  .
All rights reserved. © ASNT 2025. To report unauthorized use, contact: customersupport@asnt.org