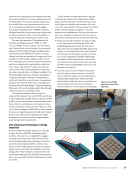
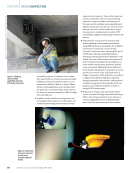
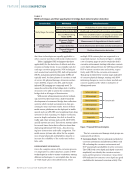
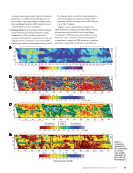
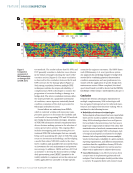
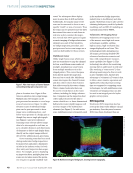
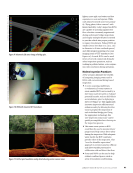
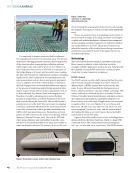
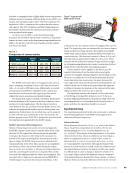
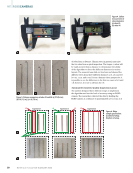
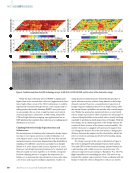
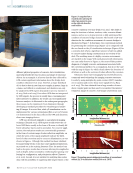
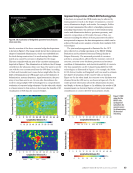
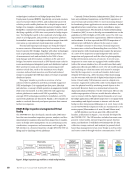
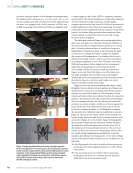
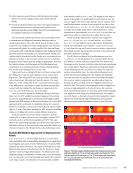
would be carried in the construction field, and at a 45° angle to maximize the FOV and minimize the data collection time. In the first setup, rebar #3 was in the middle in the second setup, rebar #3 was located on one side and in the third and final, all the rebars were #3. Figure 6 illustrates the rebar sample specifi- cation in this study. Rebar Layout Scanning Using RGBD Camera Figure 7 shows the imported data from the camera to CloudCompare and MATLAB. The camera scans the rebar sample and creates a 3D point cloud data. The camera mode that is selected for these experiments is NFOV unbinned, 30 FPS, 720p resolution. Rebar data processing needs to classify the rebar and background. Therefore, the point cloud model in Azure Kinect viewer in the .mkv format needs to be converted out to get a .ply format for further processing. Then, the .ply format point cloud model in CloudCompare software is used for preprocessing and denoising. Experiment Results and Discussion In this section, a simplified analysis by clustering that success- fully classifies the two different diameters used for this test is proposed. The results show that the proposed automated geometric quality inspection algorithm can help the inspector to identify the #3 rebar that could otherwise be missed by the human eye. The future work of this research is summarized, including accelerated automation of the proposed data collec- tion and analysis. RGBD Camera Data Analysis and Results Figure 8 illustrates the clusters. (The blue and yellow colors show rebar #4 and #3, respectively.) The first step for rebar diameter calculation is clustering the data, so a separate cluster corresponds to every single rebar. The second step is to project all the points in a cluster to the plane perpendicular to the rebar orientation. In the third step, the Pratt algorithm is implemented on the projected data. Experiment 1 Experiment 2 Experiment 3 Figure 7. Imported data from camera: (a) model 3D point cloud data (b) MATLAB plot. Figure 8. Clustering the model. Experiment 1 Experiment 2 Experiment 3 #3 #3 #3 #3 #3 #3 J A N U A R Y 2 0 2 3 • M AT E R I A L S E V A L U AT I O N 51 2301 ME Jan New.indd 51 12/20/22 8:15 AM

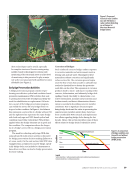
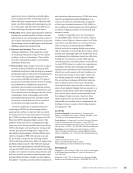
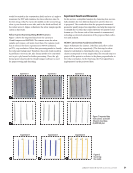
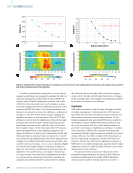
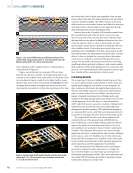
Figure 9a shows the projection of rebars to the XZ plane. The estimated circle based on the Pratt algorithm is shown in Figure 9b. Table 2 shows the diameter of different sizes of the rebar in inch and mm units. The parameters such as light, camera angle of data collection, distance, selected resolution, and FOV will affect the final result of RGBD camera 3D point cloud data. Those parameters show their effect on how the actual object and the generated 3D point cloud data differ. So, there is an error that can be representative of these effects. To consider all the sources of errors in the proposed algorithm and simplify it for the first step of using an efficient low-cost camera in automated inspection, 50% less or more than any rebar size is considered as the acceptable range for algorithm to estimate the diameter of that size. Table 3 demonstrates the output of the algorithm for each rebar in three experiments. The results show that for the three experiments, all rebar diameters are correctly estimated by using the 50% methodology explained earlier. Experiment 1 and Experiment 2 have one #3 bar located automatically in positions 2 and 4, respectively. Experiment 3 has all #3 bars located correctly. Although this algorithm was able to identify the rebar #3 location correctly, there is an error in estimating the exact diameter of the rebar in different positions of each experiment. Equation 1 represents how the error is calculated. (1) Error(%) = (_)reald−estd dreal * 100 where dest is the algorithm diameter estimation, and dreal is the diameter of the rebar based on its real size. Table 4 shows the error of the diameter estimation algo- rithm for each experiment. The average error of the algorithm is 6.47%. So, if the inspector wants to use the RGBD camera to detect the specific size of rebar and estimate the diameter, that can be a helpful way with an estimation of almost 7% error. This experiment was an example of how the RGBD camera can be used to create the 3D point cloud data of the structure and acquire geometric information of the rebar, which is nec- essary for inspecting the structure. The density of the rebar, the background, and the environmental condition will impact ME | RGBDCAMERAS Figure 9. Results of experiment: (a) rebar projection on XZ plane (b) estimated fitted circle. Experiment 1 Experiment 2 Experiment 3 #3 #3 #3 #3 #3 #3 TA B L E 2 Rebar diameter and acceptable range for algorithm Bar size Nominal diameter (in.) Nominal diameter (mm) Algorithm acceptable range for each size (mm) Minimum Max #3 0.375 9.525 7.938 11.113 #4 0.500 12.700 11.113 14.288 #5 0.625 15.875 14.288 17.463 #6 0.750 19.050 17.463 20.638 #7 0.875 22.225 20.638 23.813 #8 1.000 25.400 23.813 27.025 TA B L E 3 Diameter estimation for three experiments Estimated diameter (mm) Position 1 Position 2 Position 3 Position 4 Experiment 1 11.9 8.8 12.4 11.6 Estimated size #4 #3 #4 #4 Experiment 2 13.5 13.2 14.2 9.3 Estimated size #4 #4 #4 #3 Experiment 3 9.9 9.8 10.2 10.6 Estimated size #3 #3 #3 #3 TA B L E 4 Diameter estimation error for three experiments Error (%) Position 1 Position 2 Position 3 Position 4 Experiment 1 -5.96 -7.43 -1.96 -8.55 Experiment 2 6.50 4.55 12.35 -2.17 Experiment 3 4.83 3.56 7.79 12.03 52 M AT E R I A L S E V A L U AT I O N • J A N U A R Y 2 0 2 3 2301 ME Jan New.indd 52 12/20/22 8:15 AM
ASNT grants non-exclusive, non-transferable license of this material to  .
All rights reserved. © ASNT 2025. To report unauthorized use, contact: customersupport@asnt.org