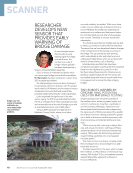
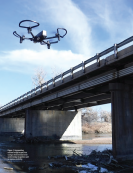
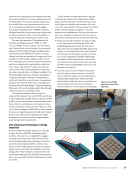
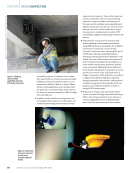
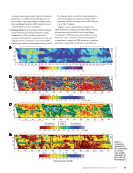
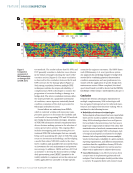
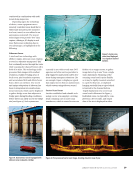
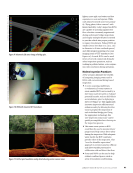
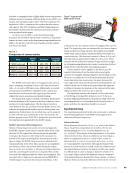
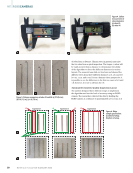
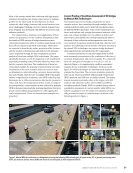
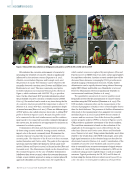
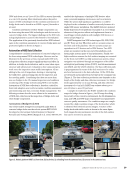
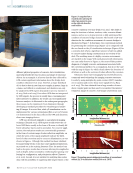
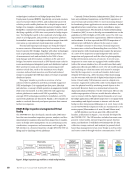
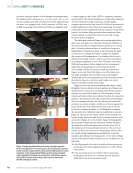
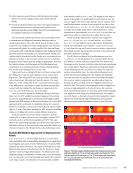
mobile and drone. The mobile part allows the robot to cling to steel surfaces and move like other conventional mobile robots. A new robot version will be able to cling to any material type surface, including concrete. On the robot, the body is attached to magnets to create an attractive force when the robot clings to a steel surface. The distance between the magnet array and the steel face is controlled by two pull motors. This distance is adjusted depending on the working condition of the robot. If the robot needs to cling strongly to the structure, then the distance is 0. Several images of the robot climbing on vertical structures of the bridge are shown in Figure 5. The robot was in mobile mode, using its wheels to climb on the elements. As shown, the robot can climb on tall elements and access dif- ficult-to-reach areas to perform inspections. If the robot needs to climb on the bridge, then the distance is larger than 0 (e.g., 0.3 cm) to allow easy crawling of the robot. The drone mode allows the robot to fly between inspection areas. In this mode, the robot uses a high-resolution camera to capture images or record video of the surface of the bridge elements and joints. At the same time, the robot sends images to the inspector for live viewing. To navigate the robot in the drone mode, the inspector wears a VR headset (5.8 GHz) to receive video data from the robot’s camera for observation of the environment at a distance of up to around 2 km. The robot uses its camera to detect available surfaces to land on the element (switching from the flying to the mobile mode). The robot relies on the values of two infrared sensors along with an intelligent landing algorithm to determine if the point in front is a safe position to land. The robot was deployed to collect data on several bridges. Both mobile and drone modes were tested to validate the design. The left side of Figure 6 shows a snapshot of a video recording of a highway bridge taken by the robot in the flying mode. There are two high-resolution images on the right of the figure showing cracked pier surface areas from the robot’s flight close to the pier. Advanced Data Visualization Like the automation discussed above, 3D visualization of NDE data is another area where improvements can be made for a more comprehensive and effective assessment of concrete bridges. Visualization allows NDE data to be presented in an intuitive manner, which will, in turn, facilitate the under- standing and further analysis of NDE test results. Unlike the conventional data processing methods, which are used to detect the presence of anomalies through measurement of GPS module RASPBERRY Pi 4 Flight controller Battery Frame GMR sensor Mobile robot IR sensor Magnets Tracking camera Figure 5. Flying robot with sensor integration: (a) overall design (b) as built and (c) images of the robot climbing on vertical surfaces of steel bridge elements. J A N U A R Y 2 0 2 3 • M AT E R I A L S E V A L U AT I O N 61 2301 ME Jan New.indd 61 12/20/22 8:15 AM

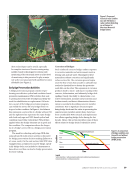
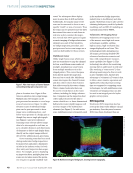
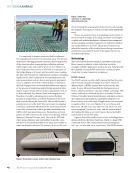
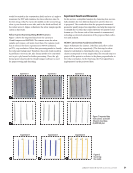
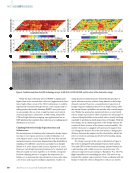
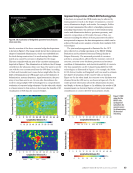
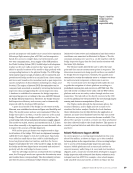
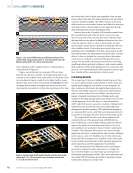
different physical properties of concrete, data visualization may help identify the exact location and shape of structural defects. As an example, it is known that the data collected by GPR contain significant information about the bridge deck condition (Tarussov et al. 2013). However, a major drawback of it is that its data in raw form are complex in nature, large in volume, and difficult to understand, and therefore can only be analyzed by GPR experts (Gucunski et al. 2013 Tarussov et al. 2013 Dinh et al. 2019). Even when GPR data are interpreted by GPR experts, the process is usually time-consuming and labor-intensive. In addition, the results can vary significantly between analysts. As illustrated in the subsequent paragraphs, these issues can be minimized, if not eliminated, through developing a standard procedure for visualizing and analyz- ing 3D images. It is noted that, while 3D visualization can be implemented for various technologies (Kim et al. 2017), herein it is demonstrated in the data collected by GPR and ultrasonic shear wave imaging devices. GPR was developed originally as a geophysical imaging technique (Daniels 2004). GPR experts would review the col- lected GPR data, usually in the form of B-scans, to identify dif- ferent subsurface layers and/or anomalies. For concrete appli- cations, the evaluation results are conventionally presented in the form of contour maps of rebar reflection amplitude, on which the areas of low signal amplitude indicate the likeli- hood of rebar corrosion and/or concrete delamination, as was shown in Figure 4. Although this method has been validated for many bridge decks, it also has some significant limitations, as pointed out in the existing literature. First, the method can lead to deceptive results due to factors affecting the amplitudes such as depth, surface anomalies, reinforcing bar spacing, rein- forcing bar configuration, and polarization effects (Tarussov et al. 2013). Second, it is not suitable for analyzing time-series data with the possibility of suggesting false improvement of the concrete condition over time (Dinh et al. 2015). The ability to map the locations of rebars, tendons, voids, concrete delami- nations, and so on, is of great interest to fully understand the condition of concrete bridge elements. The benefit of 3D visu- alization for the condition assessment of concrete bridges is illustrated in Figure 7. In this figure, the conventional method for presenting the condition map (Figure 7a) is compared with the one based on the 3D visualization technique (Figure 7b) for a concrete deck where a significant amount of salt was added to concrete mixes during construction in one section of the deck. The resulting areas of a highly corrosive environment are marked on the maps. With such ground-truth information, one can easily observe in Figure 7a, the areas of false-positive diagnosis of a highly corrosive environment associated with the conventional method. As a comparison, that is not the case with the map in Figure 7b, which clearly shows the locations of all rebars as well as the sections of rebars affected by corrosion. Ultrasonic shear wave tomography has recently become a commonly used technology for imaging concrete structures. It works by using multiple dry-point-contract (DPC) transduc- ers to transmit and receive shear wave signals (De La Haza et al. 2013). The data obtained from a large number of trans- ducer couples/pairs are then used to reconstruct the interior/ volumetric image of concrete. A 3D image created from such ME | NDEOFBRIDGES Figure 7. Presenting concrete bridge deck condition: (a) conventional method (b) 3D visualization method (Dinh et al. 2019). Attenuation (dB) Longitudinal distance (m) 0 1 2 3 4 5 6 7 8 9 3 2 1 0 0 –1 –2 –4 –6 –8 –10 –12 –14 –20 Areas of corrosive environment Areas of corrosive environment 0 1 2 3 4 5 6 7 8 9 3 2 1 0 Longitudinal distance (m) Figure 6. A snapshot from a recorded video taken by the robot. Two zoomed-in areas on the right side show the crack location. 62 M AT E R I A L S E V A L U AT I O N • J A N U A R Y 2 0 2 3 2301 ME Jan New.indd 62 12/20/22 8:15 AM Lateral distance (m) Lateral distance (m)
ASNT grants non-exclusive, non-transferable license of this material to  .
All rights reserved. © ASNT 2025. To report unauthorized use, contact: customersupport@asnt.org