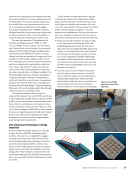
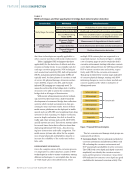
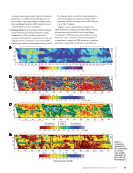
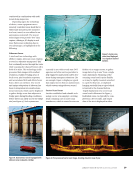
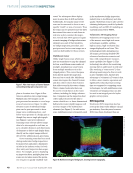
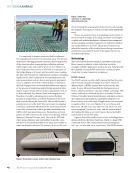
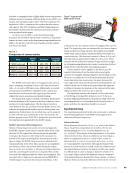
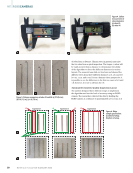
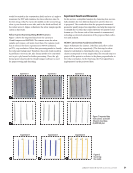
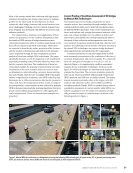
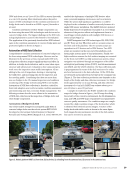
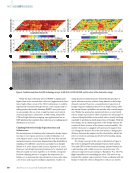
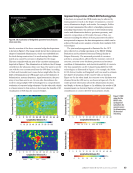
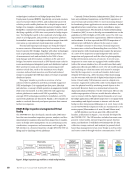
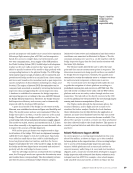
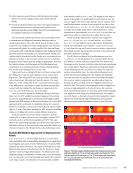
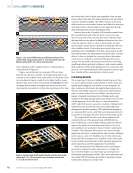
data for a section of the above concrete bridge deck specimen is shown in Figure 8. The image clearly shows the locations and shapes of simulated delamination, which was embedded into the deck during construction. It is worth noting that a delam- inated area caused by corrosion is displayed in the image. This area coincides with an area of the corrosive environment depicted in Figure 7. The delamination is visible in the 3D image created from the ultrasonic shear wave data. The same is not the case with the one reconstructed from the GPR data. According to Dinh and Gucunski (2021), some factors might affect the vis- ibility of delamination in GPR images such as the thickness of delamination, antenna frequency, signal attenuation, the prox- imity of steel bars, and so on. On one side, this indicates the need for using multiple NDE technologies for a comprehensive evaluation of concrete bridge elements. On the other side, which is of more interest to this section, it showcases the benefits of 3D visualization of NDE data for concrete bridges. Improved Interpretation of Multi-NDE Technology Data It has been recognized that NDE results may be affected by many parameters such as the degree of saturation, concrete cover, delamination depth, and similar. For example, Robles et al. (2022) summarized the effects of multiple parameters, including temperature, the presence of steel reinforcement, cracks and delamination defects, specimen geometry, and concrete composition on ER results. Because of that, cor- rections including the effects of those parameters should be incorporated to improve the data interpretation, which can be achieved through a joint analysis of results from multiple NDE technologies. The joint analysis approach is illustrated for the HCP data collected on a bridge specimen at the BEAST (Bridge Evaluation and Accelerated Structural Testing) facility at Rutgers University. The measured potential of corrosion activity is, among others, affected by the moisture content of concrete, concrete cover thickness, presence and moisture condition of delamination, and electrical resistivity of concrete. The four parameters can be evaluated using different NDE technologies, as illustrated in Figure 9. For example, the Moist- SCAN device (Goeller and Jungstadt 2018) was used to estimate the degree of saturation of the concrete slab, as shown in Figure 9a. On the other hand, the concrete cover thickness was obtained from the GPR survey, as shown in Figure 9b. The IE results provide information about the delamination location and depth, as shown in Figure 9c. In addition, the results of ER measurements, as shown in Figure 9d, have been taken into consideration to correct the HCP measurement results. Simulated delamination Corrosion-induced delamination Figure 8. 3D visualization of bridge deck specimen from ultrasonic shear wave data. Figure 9. NDE maps for the BEAST slab: (a) degree of saturation (b) concrete cover (c) delamination (d) electrical resistivity. 0 10 20 30 40 50 60 70 80 90 100 21 17 13 9 5 1 1 5 9 13 17 21 25 29 33 37 41 45 49 21 17 13 9 5 1 1 5 9 13 17 21 25 29 33 37 41 45 49 21 17 13 9 5 1 1 5 9 13 17 21 25 29 33 37 41 45 49 21 17 13 9 5 1 1 5 9 13 17 21 25 29 33 37 41 45 49 Sound Fair Poor Serious Longitudinal distance (ft.) 1 1.25 1.5 1.75 2 2.25 2.5 2.75 in. Longitudinal distance (ft.) 0 10 20 30 40 50 60 70 kOhm Longitudinal distance (ft.) Longitudinal distance (ft.) % J A N U A R Y 2 0 2 3 • M AT E R I A L S E V A L U AT I O N 63 2301 ME Jan New.indd 63 12/20/22 8:15 AM Transverse distance (f Transverse distance (f Transverse distance (f Transverse distance (f

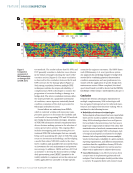
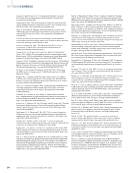
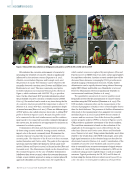
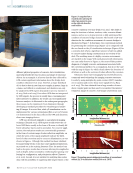
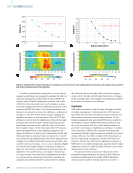
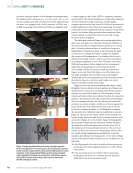
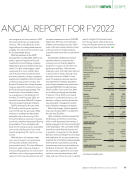
To enable improved data interpretation, a series of finite element models have been prepared to simulate the effect of mentioned parameters on the results of various NDE tech- nologies using COMSOL Multiphysics software. The results of the finite element models were used to produce an algo- rithm that mitigates the effects of different parameters on the results of the HCP. The effect of two of the parameters—the moisture content and concrete cover thickness—is illustrated in Figure 10. The HCP results before and after applying the algorithm are shown in the same figure. The raw HCP data in Figure 10c shows that the middle area of the slab has high potential values (more negative values) indicating an antic- ipated high corrosion activity, while the edges tend to have fewer negative values. On the other hand, the HCP measure- ment is modified based on four different parameters: the degree of saturation, concrete cover, delamination depth, and electrical resistivity, which are shown in Figure 10d. It can be seen clearly that the algorithm has reduced the high potential voltages in the middle of the slab because this area has a thin concrete cover (25 to 38 mm, or 1 to 1.5 in.), as shown in Figure 9b, and also has a higher degree of saturation, as shown in Figure 9a. The reference model that was used to produce the algorithm is the model that has a 40% degree of saturation, a 50 mm concrete cover, and has no delamination as well as no corrosion in the reinforcement steel bar. In general, the algorithm has modified the HCP measurements by shifting the collected values to the right of the scale (fewer negative values), while the right and left edges had almost no changes in the potential values. The changes were primarily controlled by the effect of concrete cover thickness. Conclusion NDE will be essential for both the safety of bridges and their economic management. On the safety side, NDE technolo- gies enable the detection and characterization of defects and deterioration on fracture-critical bridge members. On the bridge management side, periodical NDE surveys enable the development of more reliable deterioration, predictive and life-cycle cost models and, thus, timely implementation of preventive maintenance, rehabilitation, and repair. To achieve wide acceptance of NDE in the condition assessment and monitoring of bridges, improvements are needed in the speed of data collection, the ability to deploy NDE technologies on hard-to-reach bridge components, and the NDE data inter- pretation. The first two will lead to a significant reduction in NDE survey costs, traffic interruptions, and risks for the bridge inspectors and drivers, while the third will lead to an accurate interpretation of the condition. The presented robotic systems are illustrations of the potential for improvements in the speed of data collection, simultaneous deployment of multiple NDE technologies, reduction in the number of bridge inspectors needed to ME | NDEOFBRIDGES Figure 10. Improved HCP results interpretation: (a) calibration curves for concrete cover and (b) degree of saturation and condition maps: (c) before and (d) after implementation of the algorithm. –500 –400 –300 –200 –100 0 mV Longitudinal distance (ft.) 21 17 13 9 5 1 1 5 9 13 17 21 25 29 33 37 41 45 49 –500 –400 –300 –200 –100 0 mV Longitudinal distance (ft.) 21 17 13 9 5 1 1 5 9 13 17 21 25 29 33 37 41 45 49 y = 1.576x2 – 2.3238x + 0.3857 0 0.1 0.3 0.5 0.7 0.9 0.05 0 –0.05 –0.10 –0.15 –0.20 –0.25 –0.30 –0.35 –0.40 –0.45 –0.50 Degree of Saturation % y = –0.0276x2 + 0.193x – 0.7765 –0.65 –0.60 –0.55 –0.50 –0.45 –0.40 0.5 1.5 2.5 3.5 Concrete Cover (in) 64 M AT E R I A L S E V A L U AT I O N • J A N U A R Y 2 0 2 3 2301 ME Jan New.indd 64 12/20/22 8:15 AM Transversedistance (ft. Transversedistance (ft. Voltage (V) Voltage(V)
ASNT grants non-exclusive, non-transferable license of this material to  .
All rights reserved. © ASNT 2025. To report unauthorized use, contact: customersupport@asnt.org