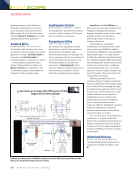
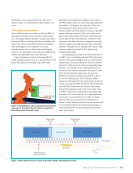
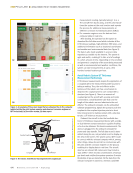
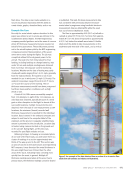
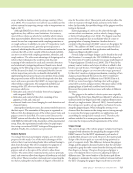
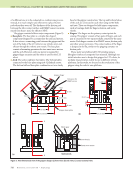
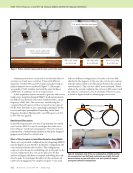
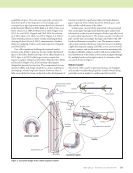
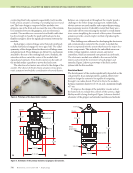
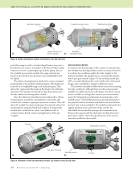
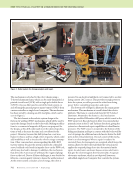
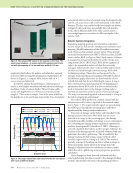
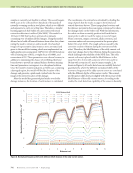
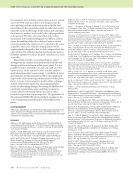
J U L Y 2 0 2 1 • M A T E R I A L S E V A L U A T I O N 691 flash drive. The data is also made available in a secure cloud-based repository with the ability to create charts, graphs, download data, and so on. Example Use Case Recently the aerial robotic system described in this paper was utilized at an in-service gas refinery in the southwestern United States. The NDT engineering company provided guidance as to the areas of concern where UT thickness measurements were required on behalf of the asset owner. These CMLs were pointed out to the aircraft system pilot by the NDT engineering company personnel. Representatives of the asset owner were onsite during the flights. The job was completed without tethered ground power to the aircraft. The total time from initial takeoff to final landing, including landings to change batteries, was under 90 min and multiple readings were obtained from more than 100 separate content monitoring locations. Weather on the date of testing was partly cloudy with winds ranging from 5 to 15 mph, generally from the east/northeast. The system is not recom- mended for use in winds over 20 mph (15 knots). The ambient temperature ranged from 80 to 90 °F (26 to 32 °C) over the course of the morning. The UT thickness measurements would have been postponed had there been weather conditions such as high winds or rain. A total of 104 CMLs were successfully sampled from 112 attempts. In eight of the 112 instances, no valid data was obtained, typically because of a wind gust or other disruption to the flight. In almost all the successful locations, multiple measurements were obtained. From the total of 535 measurements at 104 locations, the minimum (lowest) recorded wall thickness measurement is reported for the individual location. Data is stored in the onboard computer and relayed in real time to the computer tablet of the engineers on the ground. A separate simplified data stream is presented to the aircraft pilot. Location data is tracked using cameras located on the ground and on the aircraft. During flight, an HD video was recorded for post-flight analysis and use. Referring to Figure 5 showing an annotated photo of one side of the flare stack, you will notice there is a cluster of readings in a section approximately two- thirds of the way up and to the left. This section was an area of concern to the asset owner and engineering NDT company. It was theorized the metal thickness in this area might have been thinner than the other areas of the stack, indicating it was corroding more quickly than the asset in general. Multiple UT thickness readings were taken at this area. Due to privacy issues, the thickness readings cannot be shared or published. That said, thickness measurement data was consistent with previously obtained measure- ments taken by engineers using handheld electronic measurement devices utilizing lifts while the asset was out of service (Dahlstrom 2020). The flare is approximately 68 ft (20.7 m) tall with a catwalk at about 55 ft (16.8 m). Sections from approxi- mately 8 ft (2.4 m) above the ground to approximately 4 ft (1.2 m) below the catwalk were tested. A ladder obstructed the ability to take measurements on the southwest and west side of the stack, and a vertical Figure 5. An example of the data obtained from a section of an in-service flare stack (note all numbers and values are illustrative). Photo credit: ©2020 Apellix, Working Drones Inc.

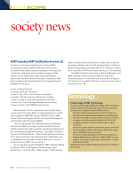
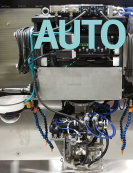
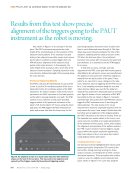
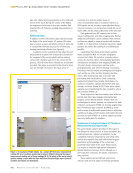
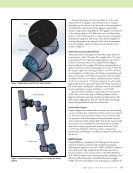
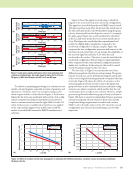
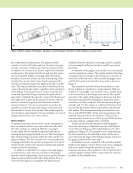
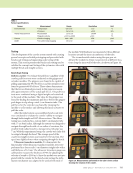
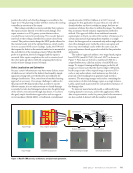
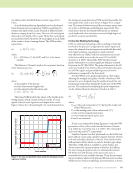
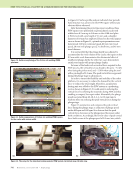
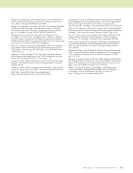
692 M A T E R I A L S E V A L U A T I O N • J U L Y 2 0 2 1 pipe rack obstructed measurements on the northeast corner of the stack. During the course of the flights, the engineers had access to the user interface that streamed the UT thickness reading measurements in real time. Additional Data In addition to the UT thickness data collected during the flight of the aerial robotic UT system, HD video was recorded, as were still photos of the UT probe tip in contact with the flare stack as the UT thickness reading was being collected (see Figure 6). In addition to the snapshot photos taken for each measurement location from onboard the aircraft and the snapshot of the aerial robotic system making contact with the flare stack from the camera on the ground, a full HD video from onboard the aircraft was recorded. This video is provided to the client for their use for example, to review it for visual areas of corrosion or to look for surface areas of concern.Localization data is included however, as GPS signals are not accurate, especially when flying close to structures, it is not precise enough for use to match CMLs on the physical geometry of the structure. Data gathered from HD cameras can include visual, multispectral, and other imaging data. Further, additional information can be collected from sensors and devices placed in physical contact with surfaces. As NDE 4.0 is data driven, industrial inspection robotic systems are perfect for enabling it and affording its benefits. Capabilities that these aerial robotic systems make available for NDE 4.0 include aerographic services that utilize 3D and other computer vision various AI, machine vision, computational geometry, simultaneous localization and mapping (SLAM) live 3D point clouds stereoscopic real-time video photogrammetry and other technology innovations. This would include mature and emerging technologies such as the use of AI, machine learning, machine vision, deep learning, big data and smart data processing and visualization, cloud computing, augmented/virtual/mixed reality, blockchains, 5G, quantum computers, special data formats and data storage, and more (Vrana 2020). These aerial robotic systems excel at gathering the data needed to unlock the potential of NDE 4.0. Visual inspection can also enable a look at the air density and detect gas leakage using optical gas imagery camera-based systems. Similar “bolt on” technologies to robotic systems can enhance the data collection component of NDE 4.0, thereby augmenting the UT thickness data collected. Outfitting a drone with an array of multimodal sensory devices collecting a plethora of data and information will enable the best success and use of NDE 4.0 as these systems provide more and better data for analysis. Drawbacks of Industrial Robotic UT Thickness Measurements and Inspections The aerial robotic system described in this paper is not always the ideal solution. In many situations, the existing inspection regime and methods can be completed relatively inexpensively and safely. They provide the requisite data and information for good operations and knowledge of the current and projected future state of the asset. Aerial robots can require a relatively high upfront investment (Global Electronic Services 2021), although on a per-inspection cost basis, the robotic inspections may cost less. These systems are aircraft with electronics onboard and are thus subject to limited operations ME FEATURE w aerial robots for ut thickness measurements Figure 6. An example of flight details: (a) a sample UT thickness measurement reading (UT-6) at condition monitoring location 9 (CML-9) showing the lowest measurement reading out of three readings (N-3) (b) photo of the aerial robotic system making contact with the flare stack from the post-flight report (note all numbers and values are illustrative). (a) (b)
ASNT grants non-exclusive, non-transferable license of this material to  .
All rights reserved. © ASNT 2026. To report unauthorized use, contact: customersupport@asnt.org