Simulation and Analysis of V-shaped Discontinuity
Magnetic Leakage Signal
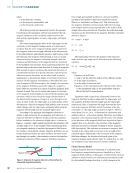
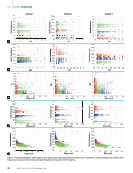
Under normal conditions, when the sample to be tested is
magnetized, the magnetic lines of force are evenly distrib-
uted inside the sample. When a discontinuity is present, the
magnetic lines of force leak and generate a leakage magnetic
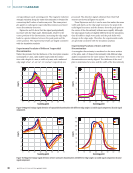
field at the discontinuity’s edge. As shown in Figure 4a, using a
V-shaped discontinuity as an example, the width of the discon-
tinuity is determined to be 4 mm, the thickness of the sample
is 5 mm, and the edge angles are 20°, 45°, and 65°, in that
order. The variation in the magnetic leakage signal is shown in
Figures 4c and 4d.
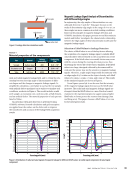
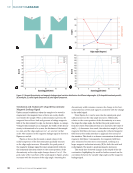
Figure 4c shows that the peak-to-peak values of the
radial component of the discontinuities gradually increase
as the edge angle increases. Meanwhile, the peak point of
the magnetic leakage signal becomes progressively wider in
the horizontal direction relative to the center position of the
discontinuity as the edge angle changes from 20° to 65°. The
peak value of the waveform of the axial signal in Figure 4d also
increases with the increase of the edge angle. Assuming the
discontinuity width remains constant, the change in the hori-
zontal direction of the axial signal is consistent with the change
in the radial signal.
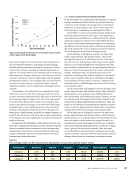
From Figure 4b, it can be seen that the signal peak grad-
ually increases as the edge angle increases. Additionally,
relative to the center position of the discontinuity at 10 mm,
the larger the edge angle, the farther the peak point moves
from the center. This indicates that as α increases, the value of
sin( 1 − α decreases. As a result, the refraction angle 2 of the
magnetic field lines decreases, causing the refracted magnetic
field lines at the media interface to approach the normal of
the interface. This leads to a denser concentration of refracted
magnetic field lines. Consequently, the magnetic field lines
after refraction become more concentrated, resulting in a
larger magnetic induction intensity (B) for both the axial and
radial signals. The peak-to-peak spacing also increases.
This study also observed changes in the depth of the dis-
continuities, highlighting the need for further research on the
correlation between the variable edge angle and the magnetic
leakage signal.
ME
|
MAGNETICLEAKAGE
80
100
60
40
40
50
60
70
80
90
100
110
120
130
140
150
160
0
20
40
60
80
9.2
9.0
8.8
8.6
8.4
8.2
8.0
7.8
100
20
–20
–40
–60
–80
–100
0
0 5 10
Scanning path (mm) Scanning path (mm)
15 20 0 5 10
Edge angle (degrees)
45°
45°
20°
20°
65°
65°
15 20
65°
45°
20°
65°
45°
20°
Figure 4. V-shaped discontinuity and magnetic leakage signal variation distribution for different edge angles: (a) V-shaped discontinuity model
(b) trend plot (c) radial signal component (d) axial signal component.
34
M AT E R I A L S E V A L U AT I O N • M AY 2 0 2 5
B
(mT)
B
(mT)
B
(mT)
L
point
Magnetic Leakage Signal
Under normal conditions, when the sample to be tested is
magnetized, the magnetic lines of force are evenly distrib-
uted inside the sample. When a discontinuity is present, the
magnetic lines of force leak and generate a leakage magnetic
field at the discontinuity’s edge. As shown in Figure 4a, using a
V-shaped discontinuity as an example, the width of the discon-
tinuity is determined to be 4 mm, the thickness of the sample
is 5 mm, and the edge angles are 20°, 45°, and 65°, in that
order. The variation in the magnetic leakage signal is shown in
Figures 4c and 4d.
Figure 4c shows that the peak-to-peak values of the
radial component of the discontinuities gradually increase
as the edge angle increases. Meanwhile, the peak point of
the magnetic leakage signal becomes progressively wider in
the horizontal direction relative to the center position of the
discontinuity as the edge angle changes from 20° to 65°. The
peak value of the waveform of the axial signal in Figure 4d also
increases with the increase of the edge angle. Assuming the
discontinuity width remains constant, the change in the hori-
zontal direction of the axial signal is consistent with the change
in the radial signal.
From Figure 4b, it can be seen that the signal peak grad-
ually increases as the edge angle increases. Additionally,
relative to the center position of the discontinuity at 10 mm,
the larger the edge angle, the farther the peak point moves
from the center. This indicates that as α increases, the value of
sin( 1 − α decreases. As a result, the refraction angle 2 of the
magnetic field lines decreases, causing the refracted magnetic
field lines at the media interface to approach the normal of
the interface. This leads to a denser concentration of refracted
magnetic field lines. Consequently, the magnetic field lines
after refraction become more concentrated, resulting in a
larger magnetic induction intensity (B) for both the axial and
radial signals. The peak-to-peak spacing also increases.
This study also observed changes in the depth of the dis-
continuities, highlighting the need for further research on the
correlation between the variable edge angle and the magnetic
leakage signal.
ME
|
MAGNETICLEAKAGE
80
100
60
40
40
50
60
70
80
90
100
110
120
130
140
150
160
0
20
40
60
80
9.2
9.0
8.8
8.6
8.4
8.2
8.0
7.8
100
20
–20
–40
–60
–80
–100
0
0 5 10
Scanning path (mm) Scanning path (mm)
15 20 0 5 10
Edge angle (degrees)
45°
45°
20°
20°
65°
65°
15 20
65°
45°
20°
65°
45°
20°
Figure 4. V-shaped discontinuity and magnetic leakage signal variation distribution for different edge angles: (a) V-shaped discontinuity model
(b) trend plot (c) radial signal component (d) axial signal component.
34
M AT E R I A L S E V A L U AT I O N • M AY 2 0 2 5
B
(mT)
B
(mT)
B
(mT)
L
point