3. AE Signal Analysis Method
This section describes in detail the acoustic emission analysis
methodology and the k-means clustering algorithm used in
this study.
3.1. Selection of AE Characteristic Parameters
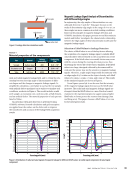
This study, considering the inherent properties of concrete,
selected 14 AE feature parameters to analyze the damage
signals of concrete under tensile stress. These parameters
include ring count, energy, absolute energy, signal strength,
amplitude, average signal level (ASL), root-mean-square (RMS)
voltage value, rise time, duration, initial frequency, average
frequency, inverse frequency, center frequency, and peak fre-
quency. The AE feature parameters and their corresponding
meanings are shown in Table 2.
3.2. K-Means Clustering Analysis Classification Method
Cluster analysis automatically divides large amounts of data
into multiple categories based on their internal similarity. It
does so without relying on any specific classification criteria,
instead organizing the data based on inherent similarities [24].
The k-means clustering algorithm is designed to partition large
data samples according to their similarities. It offers advan-
tages such as good clustering results and fast convergence
[25], providing a new approach for finding the best method
to classify AE signals, as expressed in the following formulaic
representation.
First, the optimal number of clusters, K, for cluster analysis
is determined using the Davies-Bouldin (DB) criterion [23],
hereinafter referred to as the DB coefficient. The formulaic
definition of the DB coefficient is as follows:
(1) DB = 1
K
∑
i=1
K
max
i≠j {
di + dj _
Dij }
where
di and j represent the average intra-cluster distances for
cluster and cluster respectively, and
Dij indicates the average inter-cluster distance between
cluster and cluster .
Therefore, when the DB coefficient reaches its minimum
value, it indicates that the average intra-cluster distance is
minimized while the average inter-cluster distance is max-
imized, suggesting that the clustering result is optimal. The
corresponding number of clusters, is then regarded as the
optimal number of clusters.
Let the cluster centers be denoted as 1 2 ..., k The
number of samples contained in each cluster is 1 2 ..., k ,
and the clustering content in each cluster is 1 2 ..., k Using
squared error as the objective function, the optimal clustering
result is obtained when is minimized. By calculating the sta-
tionary points of to minimize it, the clustering information j
for each cluster can be determined as follows:
(2) J(u1, u2, …,uk) = 1
2
∑
j=1i=1
K ∑
Nj ( xi − ui)2
(3) ∂ j
∂ uj
=− 2∑(x
i=1
Nj
i − ui)
(4) uj = 1
N
∑
i=1
Nj
xi
According to the results of the two-dimensional clustering
of the 14 AE feature parameters in this study, it can be deter-
mined that the number of clustering combinations obtained is
105. To select the optimal clustering combination among them,
this study employs the coefficient of variation [26] to evaluate
the horizontal effectiveness of these cluster combinations, as
illustrated in Equation 5:
ME
|
AXIALTENSION
TA B L E 2
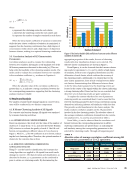
Acoustic emission (AE) characteristic parameters and their meanings
AE characterization parameters Meaning
Ring count Reflects the strength of the AE signal and can evaluate AE activity
Absolute energy, signal strength, energy Reflects the energy of the AE signal
Amplitude Reflects the strength of the AE signal and can help identify
different wave source types
ASL, RMS Evaluates the activity of AE signals and helps identify
the background noise level
Rise time Evaluates the activity of AE signals and helps identify
the background noise level
Duration Distinguishes between different types of AE wave source signals
Initial frequency, average frequency,
inverse frequency, center frequency Reflects the frequency of the AE signal
Peak frequency Distinguishes between different AE sources
44
M AT E R I A L S E V A L U AT I O N • M AY 2 0 2 5
This section describes in detail the acoustic emission analysis
methodology and the k-means clustering algorithm used in
this study.
3.1. Selection of AE Characteristic Parameters
This study, considering the inherent properties of concrete,
selected 14 AE feature parameters to analyze the damage
signals of concrete under tensile stress. These parameters
include ring count, energy, absolute energy, signal strength,
amplitude, average signal level (ASL), root-mean-square (RMS)
voltage value, rise time, duration, initial frequency, average
frequency, inverse frequency, center frequency, and peak fre-
quency. The AE feature parameters and their corresponding
meanings are shown in Table 2.
3.2. K-Means Clustering Analysis Classification Method
Cluster analysis automatically divides large amounts of data
into multiple categories based on their internal similarity. It
does so without relying on any specific classification criteria,
instead organizing the data based on inherent similarities [24].
The k-means clustering algorithm is designed to partition large
data samples according to their similarities. It offers advan-
tages such as good clustering results and fast convergence
[25], providing a new approach for finding the best method
to classify AE signals, as expressed in the following formulaic
representation.
First, the optimal number of clusters, K, for cluster analysis
is determined using the Davies-Bouldin (DB) criterion [23],
hereinafter referred to as the DB coefficient. The formulaic
definition of the DB coefficient is as follows:
(1) DB = 1
K
∑
i=1
K
max
i≠j {
di + dj _
Dij }
where
di and j represent the average intra-cluster distances for
cluster and cluster respectively, and
Dij indicates the average inter-cluster distance between
cluster and cluster .
Therefore, when the DB coefficient reaches its minimum
value, it indicates that the average intra-cluster distance is
minimized while the average inter-cluster distance is max-
imized, suggesting that the clustering result is optimal. The
corresponding number of clusters, is then regarded as the
optimal number of clusters.
Let the cluster centers be denoted as 1 2 ..., k The
number of samples contained in each cluster is 1 2 ..., k ,
and the clustering content in each cluster is 1 2 ..., k Using
squared error as the objective function, the optimal clustering
result is obtained when is minimized. By calculating the sta-
tionary points of to minimize it, the clustering information j
for each cluster can be determined as follows:
(2) J(u1, u2, …,uk) = 1
2
∑
j=1i=1
K ∑
Nj ( xi − ui)2
(3) ∂ j
∂ uj
=− 2∑(x
i=1
Nj
i − ui)
(4) uj = 1
N
∑
i=1
Nj
xi
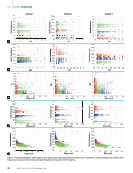
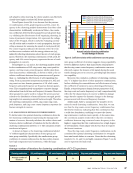
According to the results of the two-dimensional clustering
of the 14 AE feature parameters in this study, it can be deter-
mined that the number of clustering combinations obtained is
105. To select the optimal clustering combination among them,
this study employs the coefficient of variation [26] to evaluate
the horizontal effectiveness of these cluster combinations, as
illustrated in Equation 5:
ME
|
AXIALTENSION
TA B L E 2
Acoustic emission (AE) characteristic parameters and their meanings
AE characterization parameters Meaning
Ring count Reflects the strength of the AE signal and can evaluate AE activity
Absolute energy, signal strength, energy Reflects the energy of the AE signal
Amplitude Reflects the strength of the AE signal and can help identify
different wave source types
ASL, RMS Evaluates the activity of AE signals and helps identify
the background noise level
Rise time Evaluates the activity of AE signals and helps identify
the background noise level
Duration Distinguishes between different types of AE wave source signals
Initial frequency, average frequency,
inverse frequency, center frequency Reflects the frequency of the AE signal
Peak frequency Distinguishes between different AE sources
44
M AT E R I A L S E V A L U AT I O N • M AY 2 0 2 5