corresponding to each scanning point. The magnetic induction
strength variation along the entire discontinuity is obtained by
connecting the B values of each scan point. The same princi-
ple applies to subsequent trapezoidal discontinuity and inner/
outer discontinuity detection.
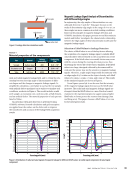
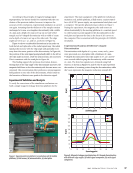
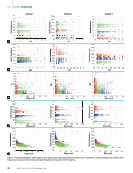
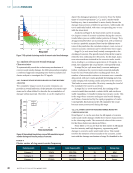
Figures 8a and 8b show that the signal peak gradually
increases with the edge angle. Additionally, relative to the
center position of the discontinuity, increasing the edge angle
leads to a greater distance between the peak point and the
center position. The experimental results are largely consistent
with the simulation analysis.
Experimental Analysis of Different Trapezoidal
Discontinuities
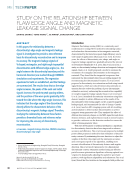
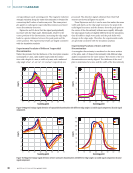
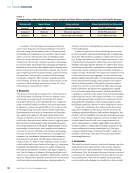
Under the premise that the thickness of the steel plate remains
unchanged at 5 mm, right-angled trapezoidal discontinu-
ities with a depth of 2 mm, a width of 4 mm, and a unilateral
edge angle of 39°, 45°, 53°, 63°, 76°, and 90°, respectively, are
processed. The detection signals obtained from their Hall
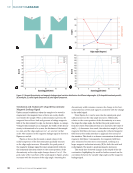
sensors are shown in Figures 9a and 9b.
From Figures 9a and 9b, it can be seen that under the same
width and depth, as the edge angle increases, the peak of the
radial signal increases, and the distance from the peak point to
the center of the discontinuity widens more rapidly. Although
the axial signal results are slightly different from the simulation,
they all exhibit a single wave peak, and the peak shifts with
changes in the edge angle. Therefore, the experimental results
are generally consistent with the simulation analysis.
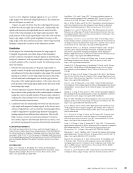
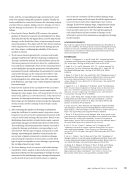
Experimental Analysis of Inner and Outer
Discontinuities
A rectangular discontinuity is machined on the inner surface
of the plate, and a V-shaped discontinuity with different edge
angles is machined on the outer surface. The centers of the two
discontinuities are exactly aligned. The thickness of the steel
plate is maintained at 5 mm, and the width of the discontinuity
ME
|
MAGNETICLEAKAGE
0 10
0
20
40
60
80
100
120
20 30
Scanning point
20
40
60
80
0
–20
–40
–60
–80
40 50 60 70 0 10 20 30
Scanning point
40 50 60 70
90°
76°
63°
53°
45°
39°
90°
76°
63°
53°
45°
39°
Figure 9. Magnetic leakage signal detection of trapezoidal discontinuities with different edge angles: (a) radial signal component (b) axial signal
component.
0 10
0
20
40
60
80
100
120
140
160
20 30
Scanning point
20
40
60
80
0
–20
–40
–60
–80
40 50 60 70 0 10 20 30
Scanning point
40 50 60 70
63°
45°
34°
63°
45°
34°
Figure 10. Magnetic leakage signal detection of inner and outer discontinuities with different edge angles: (a) radial signal component (b) axial
signal component.
38
M AT E R I A L S E V A L U AT I O N • M AY 2 0 2 5
B
(mT)
B
(mT)
B
(mT)
B
(mT)
strength variation along the entire discontinuity is obtained by
connecting the B values of each scan point. The same princi-
ple applies to subsequent trapezoidal discontinuity and inner/
outer discontinuity detection.
Figures 8a and 8b show that the signal peak gradually
increases with the edge angle. Additionally, relative to the
center position of the discontinuity, increasing the edge angle
leads to a greater distance between the peak point and the
center position. The experimental results are largely consistent
with the simulation analysis.
Experimental Analysis of Different Trapezoidal
Discontinuities
Under the premise that the thickness of the steel plate remains
unchanged at 5 mm, right-angled trapezoidal discontinu-
ities with a depth of 2 mm, a width of 4 mm, and a unilateral
edge angle of 39°, 45°, 53°, 63°, 76°, and 90°, respectively, are
processed. The detection signals obtained from their Hall
sensors are shown in Figures 9a and 9b.
From Figures 9a and 9b, it can be seen that under the same
width and depth, as the edge angle increases, the peak of the
radial signal increases, and the distance from the peak point to
the center of the discontinuity widens more rapidly. Although
the axial signal results are slightly different from the simulation,
they all exhibit a single wave peak, and the peak shifts with
changes in the edge angle. Therefore, the experimental results
are generally consistent with the simulation analysis.
Experimental Analysis of Inner and Outer
Discontinuities
A rectangular discontinuity is machined on the inner surface
of the plate, and a V-shaped discontinuity with different edge
angles is machined on the outer surface. The centers of the two
discontinuities are exactly aligned. The thickness of the steel
plate is maintained at 5 mm, and the width of the discontinuity
ME
|
MAGNETICLEAKAGE
0 10
0
20
40
60
80
100
120
20 30
Scanning point
20
40
60
80
0
–20
–40
–60
–80
40 50 60 70 0 10 20 30
Scanning point
40 50 60 70
90°
76°
63°
53°
45°
39°
90°
76°
63°
53°
45°
39°
Figure 9. Magnetic leakage signal detection of trapezoidal discontinuities with different edge angles: (a) radial signal component (b) axial signal
component.
0 10
0
20
40
60
80
100
120
140
160
20 30
Scanning point
20
40
60
80
0
–20
–40
–60
–80
40 50 60 70 0 10 20 30
Scanning point
40 50 60 70
63°
45°
34°
63°
45°
34°
Figure 10. Magnetic leakage signal detection of inner and outer discontinuities with different edge angles: (a) radial signal component (b) axial
signal component.
38
M AT E R I A L S E V A L U AT I O N • M AY 2 0 2 5
B
(mT)
B
(mT)
B
(mT)
B
(mT)