ME
|
AXIALTENSION
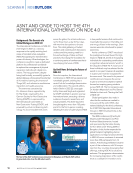
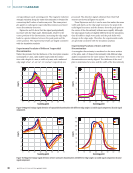
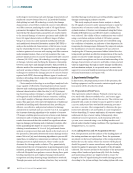
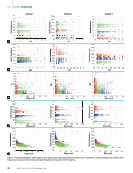
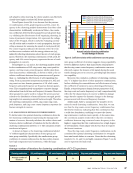
Figure 5. Clustering combination effect diagrams of AE signals under axial tensile damage of concrete C1–C3 specimens: (a) ASL–peak frequency (b) ASL–center
frequency (c) ring count–ASL (d) ring count–peak frequency (e) ring count–center frequency.
800
700
600
500
400
300
200
100
0
10 15 20 25 30
ASL
35 40 45 50
7
4
1
1
L
3 0 5
700
600
500
400
300
200
100
0
10 15 20 25 30
ASL
35 40 45 55 50
7
4
1
1 5
L
0 5
800
700
600
500
400
300
200
100
0 10 15 20 25 30
ASL
35 40
7
4
1
1 1 4 445
800
1000
1200
1400
600
400
200
0
10 15 20 25 30
ASL
35 40 45 50
0
14
4
1 1
1
1
4
700
800
900
600
5000
400
300
200
100
10 15 20 25 30
ASL
35 40 45 55 50
7
4
0
1
1 1
L
4 4
800
100001
12001
140000
600
400
200
0
10 15 20 25 30
ASL
35 40
14
4
1 4 445
10
0 50 100
Ring count
150 200 250
15
20
25
30
35
40
45
50
1
Ri
0 2 0
4
5
10
0 50 100
Ring count
150 200 250
15
20
25
30
35
400
455
1
Ri count
1 2 2
5
4
10 0 50 100
Ring count
150 200
155
20
25
30
35
400
455
1 1 2 2250
4
4
0
600
800
1000
1200
1400
400
200
0 50 100
Ring count
150 200 250
1
1
14
4
1
Ri
0 2 0
600
700
800
900
400
500
200
300
100 0 50 100
Ring count
150 200 250
7
4
1
Ring
0 2 0 0
600
8008
1000
12000
140000
4004
2002
0 50 100
Ring count
150 200 2505 1 0
700
800
0
600
300
200
100
0 50 100
Ring count
150 200 250
500
400
7
1
1
Ri
0 2 0
4
700
0
600
500
400
300
200
100
0 50 100
Ring count
150 200 250
7
4
1
1 1 2 2
700
0
600
500
300
200
0 50 100
Ring count
150 200 25002
7
4400
1100
1 0
Category 2 Category 1 Category 3
46
M AT E R I A L S E V A L U AT I O N • M AY 2 0 2 5
Peak
cfrequency
Peak
frequency y Peakfrefrequency cy
C
frequency
Center
frequency
Center
freqfrequency
ASL L AASL L AASL L
Center
ffrequency cy
Center
cfrequency Cnterffrequency cy
Peak
frfrequency y
Peak
frequency y
Peak
frq
cfrequency
|
AXIALTENSION
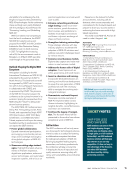
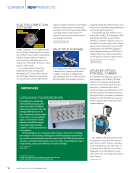
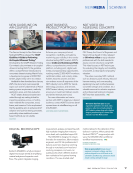
Figure 5. Clustering combination effect diagrams of AE signals under axial tensile damage of concrete C1–C3 specimens: (a) ASL–peak frequency (b) ASL–center
frequency (c) ring count–ASL (d) ring count–peak frequency (e) ring count–center frequency.
800
700
600
500
400
300
200
100
0
10 15 20 25 30
ASL
35 40 45 50
7
4
1
1
L
3 0 5
700
600
500
400
300
200
100
0
10 15 20 25 30
ASL
35 40 45 55 50
7
4
1
1 5
L
0 5
800
700
600
500
400
300
200
100
0 10 15 20 25 30
ASL
35 40
7
4
1
1 1 4 445
800
1000
1200
1400
600
400
200
0
10 15 20 25 30
ASL
35 40 45 50
0
14
4
1 1
1
1
4
700
800
900
600
5000
400
300
200
100
10 15 20 25 30
ASL
35 40 45 55 50
7
4
0
1
1 1
L
4 4
800
100001
12001
140000
600
400
200
0
10 15 20 25 30
ASL
35 40
14
4
1 4 445
10
0 50 100
Ring count
150 200 250
15
20
25
30
35
40
45
50
1
Ri
0 2 0
4
5
10
0 50 100
Ring count
150 200 250
15
20
25
30
35
400
455
1
Ri count
1 2 2
5
4
10 0 50 100
Ring count
150 200
155
20
25
30
35
400
455
1 1 2 2250
4
4
0
600
800
1000
1200
1400
400
200
0 50 100
Ring count
150 200 250
1
1
14
4
1
Ri
0 2 0
600
700
800
900
400
500
200
300
100 0 50 100
Ring count
150 200 250
7
4
1
Ring
0 2 0 0
600
8008
1000
12000
140000
4004
2002
0 50 100
Ring count
150 200 2505 1 0
700
800
0
600
300
200
100
0 50 100
Ring count
150 200 250
500
400
7
1
1
Ri
0 2 0
4
700
0
600
500
400
300
200
100
0 50 100
Ring count
150 200 250
7
4
1
1 1 2 2
700
0
600
500
300
200
0 50 100
Ring count
150 200 25002
7
4400
1100
1 0
Category 2 Category 1 Category 3
46
M AT E R I A L S E V A L U AT I O N • M AY 2 0 2 5
Peak
cfrequency
Peak
frequency y Peakfrefrequency cy
C
frequency
Center
frequency
Center
freqfrequency
ASL L AASL L AASL L
Center
ffrequency cy
Center
cfrequency Cnterffrequency cy
Peak
frfrequency y
Peak
frequency y
Peak
frq
cfrequency