4.2. Analysis of Concrete Tensile Damage
Characteristics
To systematically reveal the evolutionary mechanisms of
concrete axial tensile damage, the following analysis employs
a combined approach integrating time-history analysis and
cluster analysis to investigate the AE signals.
4.2.1. DAMAGE STAGE DIVISION BASED ON TIME HISTORY
ANALYSIS
The cumulative impact count of acoustic emissions can
provide an overall reflection of the intensity of acoustic emis-
sions and is often utilized to describe the accumulation of
damage within materials. Therefore, it can be employed to
depict the damage progression of concrete. Since the failure
times of concrete specimens C1, C2, and C3 under tensile
loading vary, time is normalized to more clearly discern the
damage characteristics of different specimens. Additionally, the
test is uniformly loaded, with time corresponding one-to-one
with the stress level.
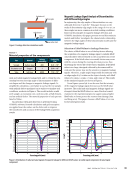
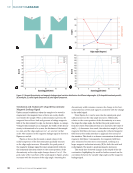
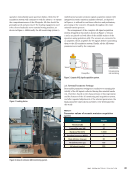
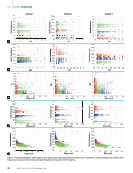
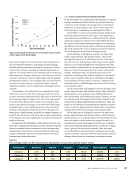
As shown in Figure 8, the time-series curves of cumula-
tive impact counts of acoustic emissions during the concrete
tensile failure process exhibit similar patterns of change. They
all approximately follow an increasing trend, with a tendency
to rise in a parabolic manner. Based on the different curva-
tures of the parabolas, the cumulative impact count curves of
concrete acoustic emissions can be divided into three stages.
Stage D1 (0–20% stress level) mainly corresponds to the
cracking of concrete. The growth trend of the AE hit count is
relatively slow, indicating low AE activity. In this stage, many
new microcracks are initiated in the concrete under tensile
stress, leading to a continuous generation of AE signals. As a
result, the cumulative hit count shows a slow growth trend.
In stage D2 (20–75% stress level), concrete undergoes
further cracking as the concrete matrix material gradually
bears the load. Particularly after reaching peak stress, the
number of microcracks continues to increase over a consider-
able period, with new cracks gradually developing and even-
tually merging with existing cracks and pores in the concrete.
This leads to more noticeable AE activity, causing the trend of
the cumulative hit count to accelerate.
In stage D3 (75–100% stress level), the cracking of the
concrete matrix has reached a certain width, and cracks are
stably expanding, eventually forming macroscopic cracks. This
is the stage where concrete undergoes axial tensile damage
and failure, characterized by the rapid propagation of cracks.
Consequently, fluctuations in the AE cumulative hit count
become more pronounced during this stage.
4.2.2. CLASSIFICATION OF DAMAGE DEGREE BASED ON
CLUSTER ANALYSIS
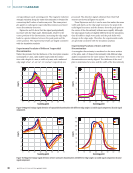
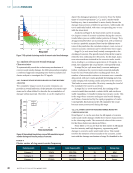
From Figure 7, it can be seen that the AE signals of concrete
under axial tensile damage exhibit three-cluster characteristics
in the clustering results. The numerical values of the centers
for the three clusters are shown in Table 5.
From Table 5, we can see that the first cluster of AE signals
has low intensity and high frequency, representing mild
damage in concrete under axial tensile stress. This mainly
involves the initiation of microcracks in the concrete, consis-
tent with the damage mechanism of stage D1 identified in the
ME
|
AXIALTENSION
0
1000 D1
D2
D3
2000
3000
4000
5000
6000
0 0.2 0.4 0.6 0.8 1.00
Time (normalized)
Category 1
Category 2
Category 3
4
0
0 2 0 0 0 8
y
ategory
Figure 8. Normalized time history curve of AE cumulative impact
number during axial tensile process of concrete.
6000
700
8000
900
4000
500
200
300
100
0 50 100
Ring count
150 200 2502
0
0
1
1 2
Figure 7. AE optimal clustering results of concrete axial tensile damage.
TA B L E 5
Cluster center of ring count–center frequency
Clustering results Ring count Center frequency (kHz) Signal proportion (%)Damage stage
Category 1 2.3676 595.7006 25 Mild
Category 2 7.0207 499.5985 30 Medium
Category 3 37.0240 341.0939 45 Severe
48
M AT E R I A L S E V A L U AT I O N • M AY 2 0 2 5
Accumulated
number
of AE
impacts
C
frequency y
Characteristics
To systematically reveal the evolutionary mechanisms of
concrete axial tensile damage, the following analysis employs
a combined approach integrating time-history analysis and
cluster analysis to investigate the AE signals.
4.2.1. DAMAGE STAGE DIVISION BASED ON TIME HISTORY
ANALYSIS
The cumulative impact count of acoustic emissions can
provide an overall reflection of the intensity of acoustic emis-
sions and is often utilized to describe the accumulation of
damage within materials. Therefore, it can be employed to
depict the damage progression of concrete. Since the failure
times of concrete specimens C1, C2, and C3 under tensile
loading vary, time is normalized to more clearly discern the
damage characteristics of different specimens. Additionally, the
test is uniformly loaded, with time corresponding one-to-one
with the stress level.
As shown in Figure 8, the time-series curves of cumula-
tive impact counts of acoustic emissions during the concrete
tensile failure process exhibit similar patterns of change. They
all approximately follow an increasing trend, with a tendency
to rise in a parabolic manner. Based on the different curva-
tures of the parabolas, the cumulative impact count curves of
concrete acoustic emissions can be divided into three stages.
Stage D1 (0–20% stress level) mainly corresponds to the
cracking of concrete. The growth trend of the AE hit count is
relatively slow, indicating low AE activity. In this stage, many
new microcracks are initiated in the concrete under tensile
stress, leading to a continuous generation of AE signals. As a
result, the cumulative hit count shows a slow growth trend.
In stage D2 (20–75% stress level), concrete undergoes
further cracking as the concrete matrix material gradually
bears the load. Particularly after reaching peak stress, the
number of microcracks continues to increase over a consider-
able period, with new cracks gradually developing and even-
tually merging with existing cracks and pores in the concrete.
This leads to more noticeable AE activity, causing the trend of
the cumulative hit count to accelerate.
In stage D3 (75–100% stress level), the cracking of the
concrete matrix has reached a certain width, and cracks are
stably expanding, eventually forming macroscopic cracks. This
is the stage where concrete undergoes axial tensile damage
and failure, characterized by the rapid propagation of cracks.
Consequently, fluctuations in the AE cumulative hit count
become more pronounced during this stage.
4.2.2. CLASSIFICATION OF DAMAGE DEGREE BASED ON
CLUSTER ANALYSIS
From Figure 7, it can be seen that the AE signals of concrete
under axial tensile damage exhibit three-cluster characteristics
in the clustering results. The numerical values of the centers
for the three clusters are shown in Table 5.
From Table 5, we can see that the first cluster of AE signals
has low intensity and high frequency, representing mild
damage in concrete under axial tensile stress. This mainly
involves the initiation of microcracks in the concrete, consis-
tent with the damage mechanism of stage D1 identified in the
ME
|
AXIALTENSION
0
1000 D1
D2
D3
2000
3000
4000
5000
6000
0 0.2 0.4 0.6 0.8 1.00
Time (normalized)
Category 1
Category 2
Category 3
4
0
0 2 0 0 0 8
y
ategory
Figure 8. Normalized time history curve of AE cumulative impact
number during axial tensile process of concrete.
6000
700
8000
900
4000
500
200
300
100
0 50 100
Ring count
150 200 2502
0
0
1
1 2
Figure 7. AE optimal clustering results of concrete axial tensile damage.
TA B L E 5
Cluster center of ring count–center frequency
Clustering results Ring count Center frequency (kHz) Signal proportion (%)Damage stage
Category 1 2.3676 595.7006 25 Mild
Category 2 7.0207 499.5985 30 Medium
Category 3 37.0240 341.0939 45 Severe
48
M AT E R I A L S E V A L U AT I O N • M AY 2 0 2 5
Accumulated
number
of AE
impacts
C
frequency y