According to the principle of magnetic leakage signal
superposition, the theory should be consistent with the con-
clusion of the previous studies however, to improve the
accuracy of the conclusions, experimental simulation is carried
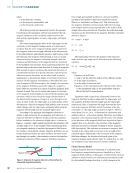
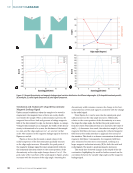
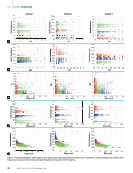
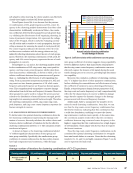
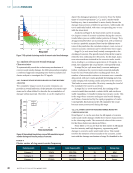
out again. Assuming that the thickness of the sample remains
unchanged at 5 mm, a rectangular discontinuity with a width
of 4 mm and a depth of 2 mm is set up on one side of the
sample, and a V-shaped discontinuity with a width of 4 mm
and a depth of 2 mm is set up on the other side. The edge
angles are set to 34°, 45°, and 63°, as shown in Figure 6a.
Figure 6c shows considerable fluctuations in the peaks on
both the left and right sides of the radial signal map. The radial
signal peaks increase with the edge angle and gradually move
away from the center position of the discontinuity. In Figure 6d,
the position of the axial signal peak gradually shifts to the left as
the edge angle increases, while the peak intensity also increases.
This is consistent with the trend plot in Figure 6b.
This finding supports the previous observation, demon-
strating that as the edge angle of the discontinuity increases, the
magnetic field lines on the discontinuity side become more con-
centrated. This concentration effect produces a strong magnetic
field gradient on one side of the discontinuity, which results in
the formation of distinct wave peaks in the detection signal.
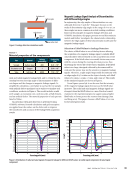
Experimental Validation and Analysis
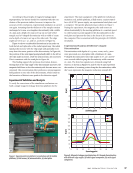
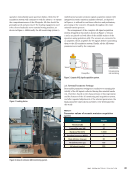
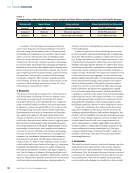
To verify the correctness of the simulation conclusions, we
built a simple magnetic leakage detection platform for the
experiment. The main equipment of the platform includes an
excitation coil, mobile platform, a Hall sensor, a microcontrol-
ler, a 5A AC/DC power supply, an experimental steel plate, and
a computer. The specific physical setup is shown in Figure 7.
During the experiment, the magnetic yoke and sensor are
driven horizontally by the moving platform at a constant speed
to collect point-to-point signals for the discontinuities on the
steel plate and present the data in the form of 2D curves on
the computer. This is consistent with the principle of COMSOL
simulation.
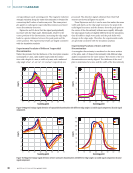
Experimental Analysis of Different V-shaped
Discontinuities
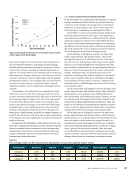
Discontinuities with depths of 0.73 mm, 2 mm, and 4.3 mm
were processed on a steel plate with a thickness of 5 mm.
V-shaped discontinuities with edge angles of 20°, 45°, and 65°
were created while keeping the discontinuity width constant
at 4 mm. The detection signals were obtained using Hall
sensors, as shown in Figures 8a and 8b. The X-axis represents
the number of scanning points along the discontinuities, while
the Y-axis represents the magnetic induction strength (B)
0 10
0
20
40
60
80
100
120
140
160
180
20 30
Scanning point
100
50
0
–50
–100
–150
150
40 50 60 70
0 10 20 30
Scanning point
40 50 60 70
65°
45°
20°
65°
45°
20°
Figure 8. Magnetic leakage signal detection of V-shaped discontinuities
with different edge angles: (a) radial signal component (b) axial signal
component.
Figure 7. Experimental test platform: (a) excitation coil (b) mobile
platform (c) Hall sensor (d) microcontroller (e) steel plate.
M AY 2 0 2 5 • M AT E R I A L S E V A L U AT I O N 37
B
(mT)
B
(mT)
superposition, the theory should be consistent with the con-
clusion of the previous studies however, to improve the
accuracy of the conclusions, experimental simulation is carried
out again. Assuming that the thickness of the sample remains
unchanged at 5 mm, a rectangular discontinuity with a width
of 4 mm and a depth of 2 mm is set up on one side of the
sample, and a V-shaped discontinuity with a width of 4 mm
and a depth of 2 mm is set up on the other side. The edge
angles are set to 34°, 45°, and 63°, as shown in Figure 6a.
Figure 6c shows considerable fluctuations in the peaks on
both the left and right sides of the radial signal map. The radial
signal peaks increase with the edge angle and gradually move
away from the center position of the discontinuity. In Figure 6d,
the position of the axial signal peak gradually shifts to the left as
the edge angle increases, while the peak intensity also increases.
This is consistent with the trend plot in Figure 6b.
This finding supports the previous observation, demon-
strating that as the edge angle of the discontinuity increases, the
magnetic field lines on the discontinuity side become more con-
centrated. This concentration effect produces a strong magnetic
field gradient on one side of the discontinuity, which results in
the formation of distinct wave peaks in the detection signal.
Experimental Validation and Analysis
To verify the correctness of the simulation conclusions, we
built a simple magnetic leakage detection platform for the
experiment. The main equipment of the platform includes an
excitation coil, mobile platform, a Hall sensor, a microcontrol-
ler, a 5A AC/DC power supply, an experimental steel plate, and
a computer. The specific physical setup is shown in Figure 7.
During the experiment, the magnetic yoke and sensor are
driven horizontally by the moving platform at a constant speed
to collect point-to-point signals for the discontinuities on the
steel plate and present the data in the form of 2D curves on
the computer. This is consistent with the principle of COMSOL
simulation.
Experimental Analysis of Different V-shaped
Discontinuities
Discontinuities with depths of 0.73 mm, 2 mm, and 4.3 mm
were processed on a steel plate with a thickness of 5 mm.
V-shaped discontinuities with edge angles of 20°, 45°, and 65°
were created while keeping the discontinuity width constant
at 4 mm. The detection signals were obtained using Hall
sensors, as shown in Figures 8a and 8b. The X-axis represents
the number of scanning points along the discontinuities, while
the Y-axis represents the magnetic induction strength (B)
0 10
0
20
40
60
80
100
120
140
160
180
20 30
Scanning point
100
50
0
–50
–100
–150
150
40 50 60 70
0 10 20 30
Scanning point
40 50 60 70
65°
45°
20°
65°
45°
20°
Figure 8. Magnetic leakage signal detection of V-shaped discontinuities
with different edge angles: (a) radial signal component (b) axial signal
component.
Figure 7. Experimental test platform: (a) excitation coil (b) mobile
platform (c) Hall sensor (d) microcontroller (e) steel plate.
M AY 2 0 2 5 • M AT E R I A L S E V A L U AT I O N 37
B
(mT)
B
(mT)