operation immediately upon specimen failure, while the AE
acquisition system will continue to work for about 5 s to ensure
the comprehensiveness of the AE signals. All data should be
promptly saved and processed. The loading equipment used
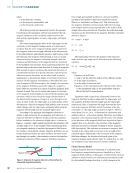
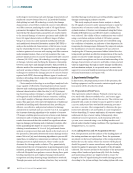
is the electro-hydraulic servo material testing machine, as
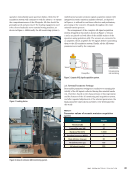
shown in Figure 1. Additionally, the AE monitoring system (a
multichannel acoustic emission signal acquisition system with
integrated acoustic emission analysis software), as depicted
in Figure 2, is utilized for real-time collection and preliminary
processing of the concrete AE signals throughout the entire
uniaxial tension process.
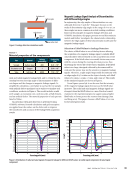
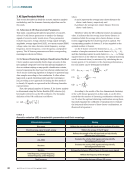
The arrangement of the complete AE signal acquisition
system designed in this study is shown in Figure 3. Sensors
1 and 2 are placed on both sides of the middle surface of the
specimen using petroleum jelly. The sensors are connected to
an amplifier, which amplifies the AE signals before transmitting
them to the AE acquisition system. Finally, all the AE feature
parameters are read by the computer.
2.3. System Parameter Settings
Reasonable parameter settings are conducive to ensuring the
validity of the AE signals collected during this uniaxial tensile
test. Therefore, based on the characteristics of this experiment
and the features of the AE monitoring and acquisition system,
and after repeated adjustments of the relevant parameters, the
final parameter values shown in Table 1 were determined for
this study.
Figure 1. Loading device.
Figure 2. Acoustic emission (AE) monitoring system.
TA B L E 1
Parameter values of acoustic emission acquisition
system
Parameters Set point
Threshold (dB) 35
Preamplifier gain (dB) 40
Bandpass filter (kHz) 1–3000
Sampling frequency (MSPS) 5
Peak definition time (µs) 50
Hit definition time (µs) 100
Hit lockout time (µs) 300
Sensor 1 Sensor 2
Preamplifier
Data processing
and monitoring
Figure 3. Layout of AE signal acquisition system.
M AY 2 0 2 5 • M AT E R I A L S E V A L U AT I O N 43
acquisition system will continue to work for about 5 s to ensure
the comprehensiveness of the AE signals. All data should be
promptly saved and processed. The loading equipment used
is the electro-hydraulic servo material testing machine, as
shown in Figure 1. Additionally, the AE monitoring system (a
multichannel acoustic emission signal acquisition system with
integrated acoustic emission analysis software), as depicted
in Figure 2, is utilized for real-time collection and preliminary
processing of the concrete AE signals throughout the entire
uniaxial tension process.
The arrangement of the complete AE signal acquisition
system designed in this study is shown in Figure 3. Sensors
1 and 2 are placed on both sides of the middle surface of the
specimen using petroleum jelly. The sensors are connected to
an amplifier, which amplifies the AE signals before transmitting
them to the AE acquisition system. Finally, all the AE feature
parameters are read by the computer.
2.3. System Parameter Settings
Reasonable parameter settings are conducive to ensuring the
validity of the AE signals collected during this uniaxial tensile
test. Therefore, based on the characteristics of this experiment
and the features of the AE monitoring and acquisition system,
and after repeated adjustments of the relevant parameters, the
final parameter values shown in Table 1 were determined for
this study.
Figure 1. Loading device.
Figure 2. Acoustic emission (AE) monitoring system.
TA B L E 1
Parameter values of acoustic emission acquisition
system
Parameters Set point
Threshold (dB) 35
Preamplifier gain (dB) 40
Bandpass filter (kHz) 1–3000
Sampling frequency (MSPS) 5
Peak definition time (µs) 50
Hit definition time (µs) 100
Hit lockout time (µs) 300
Sensor 1 Sensor 2
Preamplifier
Data processing
and monitoring
Figure 3. Layout of AE signal acquisition system.
M AY 2 0 2 5 • M AT E R I A L S E V A L U AT I O N 43