(5) S =
√ ______________
1
N ∑ i=1 Nj (x − u ____________j)ji
uj
where
uj represents the clustering center for each cluster,
xi represents the clustering content for each cluster, and
Nj represents the number of samples contained in each cluster.
When the intra-cluster coefficient of variation is minimized
while the inter-cluster coefficient of variation is maximized, it
suggests that the clustering combination has a high degree of
concentration within clusters and a high degree of dispersion
between clusters, making it an optimal clustering combination.
3.3. Correlation Analysis of AE Characteristic
Parameters
Correlation analysis is used to examine the relationship
between two variables, allowing for a self-similarity test of the
AE feature parameters discussed in this study [27]. This can
help verify the feasibility of the clustering analysis results. The
metric used to evaluate the correlation between two variables
is the correlation coefficient xy as shown in Equation 6:
(6) rxy = ∑ i=1(xi n −
_
)(yi −
_
) _______________
√
___________________
∑ i=1(xi n −
_
) 2 (yi −
_
) 2
When the absolute value of the correlation coefficient is
greater than 0.5, it indicates a strong correlation between the
two corresponding parameters, suggesting that the clustering
analysis results are reliable.
4. Results and Analysis
The analysis of axial tensile damage signals in concrete struc-
tures will be conducted in two distinct components.
4.1. K-Means Clustering Analysis of AE Signals
The concrete axial tension damage AE signals were analyzed
by k-means clustering as follows.
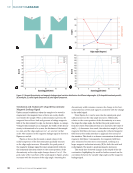
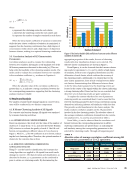
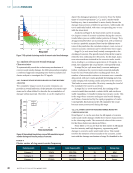
4.1.1. OPTIMIZATION OF CLUSTER NUMBER K
Based on experience, this study sets the value of the number of
clusters, to range from 2 to 10, and uses the Davies-Bouldin
(DB) criterion to evaluate the quality of each The DB coef-
ficients corresponding to different values of are shown in
Figure 4. When =3, the DB coefficient is at its lowest, indicat-
ing the best clustering effect. Therefore, the optimal number of
clusters for the concrete data is three.
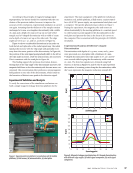
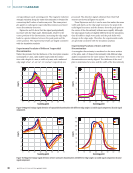
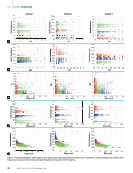
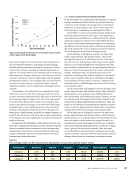
4.1.2. EFFECTIVE CLUSTERING COMBINATIONS
AND RELATED ANALYSIS
Using =3 as the basis for classification, the k-means clus-
tering algorithm was applied to AE signals from axial tensile
damage in concrete. After data iteration and classification, as
described in Section 3.1, 14 parameters can be combined in
pairs to obtain 105 clustering results. By discriminating the
aggregation properties of the results, five sets of clustering
results with clear classification features were selected. The
effective cluster combinations are shown in Figure 5.
From Figure 5, it can be observed that the k-means cluster-
ing results for specimens C1, C2, and C3 exhibit a high degree
of similarity, both in terms of graphical distribution and the
delineation of each cluster, which confirms the accuracy of
the clustering results. Additionally, it is evident that, for the
inter-cluster parameters, there is little overlap between differ-
ent clusters, demonstrating clear differences between them.
As for the intra-cluster parameters, the clustering centers are
located at the center of the signals within the cluster, indicating
a strong clustering effect. Based on this, we can conclude that
these five sets of clustering results are quite satisfactory.
To explore the reasons why these five sets of parameter
clustering results are considered ideal, it can be seen that the
selected clustering parameters have strong correlations among
themselves, indicating inherent self-similarity within the data.
This provides a solid foundation for the cluster analysis. The
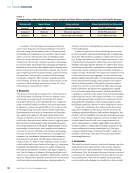
study conducts correlation analysis on the AE parameters
involved in the five clustering results. The absolute values of
the average correlation coefficients obtained from the correla-
tion analysis of C1, C2, and C3 are presented in Table 3.
From Table 3, it can be observed that the correlation coef-
ficients between the corresponding parameters in all five
clustering combinations are greater than 0.5, indicating the
self-similarity among the corresponding parameters in the
selected five clustering results. Through self-organizing and
1.0
0.9
0.8
0.7
0.6
0.5
0.4
0.3
0.2
0.1
0.0
2 3 4 5 6
Number of clusters K
7 8 9 10
Figure 4. The Davies-Bouldin (DB) coefficient of concrete under different
numbers of clusters (K).
TA B L E 3
Absolute value of average correlation coefficient among AE
characteristic parameters of C1–C3 specimens
Ring count ASL Center frequency Peak frequency
Ring count 1 0.745 0.858 0.598
ASL 0.745 1 0.546 0.624
Center frequency 0.858 0.546 1 0.142
Peak frequency 0.598 0.624 0.142 1
M AY 2 0 2 5 • M AT E R I A L S E V A L U AT I O N 45
DB
coefficient
√ ______________
1
N ∑ i=1 Nj (x − u ____________j)ji
uj
where
uj represents the clustering center for each cluster,
xi represents the clustering content for each cluster, and
Nj represents the number of samples contained in each cluster.
When the intra-cluster coefficient of variation is minimized
while the inter-cluster coefficient of variation is maximized, it
suggests that the clustering combination has a high degree of
concentration within clusters and a high degree of dispersion
between clusters, making it an optimal clustering combination.
3.3. Correlation Analysis of AE Characteristic
Parameters
Correlation analysis is used to examine the relationship
between two variables, allowing for a self-similarity test of the
AE feature parameters discussed in this study [27]. This can
help verify the feasibility of the clustering analysis results. The
metric used to evaluate the correlation between two variables
is the correlation coefficient xy as shown in Equation 6:
(6) rxy = ∑ i=1(xi n −
_
)(yi −
_
) _______________
√
___________________
∑ i=1(xi n −
_
) 2 (yi −
_
) 2
When the absolute value of the correlation coefficient is
greater than 0.5, it indicates a strong correlation between the
two corresponding parameters, suggesting that the clustering
analysis results are reliable.
4. Results and Analysis
The analysis of axial tensile damage signals in concrete struc-
tures will be conducted in two distinct components.
4.1. K-Means Clustering Analysis of AE Signals
The concrete axial tension damage AE signals were analyzed
by k-means clustering as follows.
4.1.1. OPTIMIZATION OF CLUSTER NUMBER K
Based on experience, this study sets the value of the number of
clusters, to range from 2 to 10, and uses the Davies-Bouldin
(DB) criterion to evaluate the quality of each The DB coef-
ficients corresponding to different values of are shown in
Figure 4. When =3, the DB coefficient is at its lowest, indicat-
ing the best clustering effect. Therefore, the optimal number of
clusters for the concrete data is three.
4.1.2. EFFECTIVE CLUSTERING COMBINATIONS
AND RELATED ANALYSIS
Using =3 as the basis for classification, the k-means clus-
tering algorithm was applied to AE signals from axial tensile
damage in concrete. After data iteration and classification, as
described in Section 3.1, 14 parameters can be combined in
pairs to obtain 105 clustering results. By discriminating the
aggregation properties of the results, five sets of clustering
results with clear classification features were selected. The
effective cluster combinations are shown in Figure 5.
From Figure 5, it can be observed that the k-means cluster-
ing results for specimens C1, C2, and C3 exhibit a high degree
of similarity, both in terms of graphical distribution and the
delineation of each cluster, which confirms the accuracy of
the clustering results. Additionally, it is evident that, for the
inter-cluster parameters, there is little overlap between differ-
ent clusters, demonstrating clear differences between them.
As for the intra-cluster parameters, the clustering centers are
located at the center of the signals within the cluster, indicating
a strong clustering effect. Based on this, we can conclude that
these five sets of clustering results are quite satisfactory.
To explore the reasons why these five sets of parameter
clustering results are considered ideal, it can be seen that the
selected clustering parameters have strong correlations among
themselves, indicating inherent self-similarity within the data.
This provides a solid foundation for the cluster analysis. The
study conducts correlation analysis on the AE parameters
involved in the five clustering results. The absolute values of
the average correlation coefficients obtained from the correla-
tion analysis of C1, C2, and C3 are presented in Table 3.
From Table 3, it can be observed that the correlation coef-
ficients between the corresponding parameters in all five
clustering combinations are greater than 0.5, indicating the
self-similarity among the corresponding parameters in the
selected five clustering results. Through self-organizing and
1.0
0.9
0.8
0.7
0.6
0.5
0.4
0.3
0.2
0.1
0.0
2 3 4 5 6
Number of clusters K
7 8 9 10
Figure 4. The Davies-Bouldin (DB) coefficient of concrete under different
numbers of clusters (K).
TA B L E 3
Absolute value of average correlation coefficient among AE
characteristic parameters of C1–C3 specimens
Ring count ASL Center frequency Peak frequency
Ring count 1 0.745 0.858 0.598
ASL 0.745 1 0.546 0.624
Center frequency 0.858 0.546 1 0.142
Peak frequency 0.598 0.624 0.142 1
M AY 2 0 2 5 • M AT E R I A L S E V A L U AT I O N 45
DB
coefficient