self-adaptive online learning, the cluster analysis can effectively
classify these highly correlated AE feature parameters.
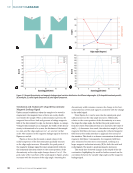
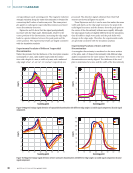
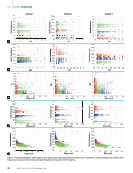
From Figures 5a and 5b, it can be seen that the parame-
ter combinations of ASL–peak frequency and ASL–center fre-
quency in the clustering analysis demonstrate clear three-class
characteristics. Additionally, as shown in Table 3, the correla-
tion coefficients between these parameters are all greater than
0.5, validating the effectiveness of self-organizing clustering. In
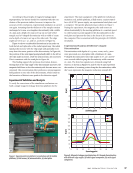
terms of parameter interpretation, ASL represents the voltage
value of the AE signal, which is useful for evaluating continu-
ous AE activity and is sensitive to crack propagation, thus pro-
viding a measure for assessing the speed of crack growth [28].
The center frequency indicates the intensity of the AE event
and has some correlation with the energy release rate [29],
indirectly reflecting information about the rate of crack propa-
gation. Therefore, the clustering combination of ASL–peak fre-
quency and ASL–center frequency represents the rate of crack
propagation in concrete.
From Figures 5c, 5d, and 5e, the clustering analysis results
for the combinations of ASL–ring count, ring count–peak fre-
quency, and ring count–center frequency exhibit clear three-
class characteristics. Additionally, as shown in Table 3, the cor-
relation coefficients between these parameters are all greater
than 0.5, validating the effectiveness of self-organizing clus-
tering. From a parameter interpretation perspective, ASL and
ring count are time-domain parameters of AE, while center
frequency and peak frequency are frequency-domain param-
eters. This comprehensively encapsulates concrete damage
information from both time and frequency domains. Moreover,
these parameters can be used to evaluate AE activity and are
related to the distribution of material fracture strength, provid-
ing insights into assessing material fracture strength. Therefore,
the clustering combinations of ASL–ring count, ring count–
peak frequency, and ring count–center frequency represent the
fracture strength of concrete.
4.1.3. EVALUATION OF OPTIMAL CLUSTERING RESULTS
To further select the optimal clustering combination from the
five clustering combinations representing the damage infor-
mation of concrete, this study calculates the within-cluster and
between-cluster coefficients of variation for the five effective
clustering combinations labeled a to e. The calculation results
are shown in Figure 6.
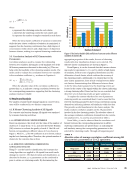
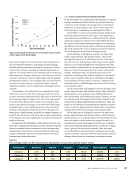
As shown in Figure 6, the clustering combination labeled
“e” exhibits significant characteristics of intra-group and
inter-group variability. Specifically, the smaller intra-group
coefficient of variation indicates that the data within clusters
have high compactness and consistency, while the larger
inter-group coefficient of variation suggests strong separability
between different clusters. This characteristic demonstrates
that the ring count–center frequency combination can more
effectively capture the features of AE signals during the axial
tensile damage process in concrete, providing high discrimina-
tion capability.
Moreover, the correlation coefficient of clustering combina-
tion “e” is higher than those of other parameter combinations,
further validating the reasonableness and effectiveness of using
the coefficient of variation to assess clustering performance.
Finally, as time-frequency domain feature parameters of AE,
the ring count and center frequency not only comprehensively
reflect the AE characteristics of concrete at different damage
stages but also capture the dynamic changes in the damage
process across both time and frequency domains.
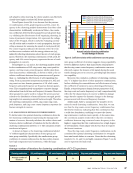
Additionally, Table 4 summarizes the number of iter-
ations for each clustering combination. From this, we can
see that the ring count–center frequency combination has
the fewest iterations, indicating that this combination has
a solid data foundation, enabling it to meet the cluster-
ing termination condition more quickly. At the same time,
the correlation analysis results show that the correlation
coefficient between ring count and center frequency is the
highest, suggesting that this combination has a high degree
of self-similarity, which aligns with the fact that it requires
the fewest iterations.
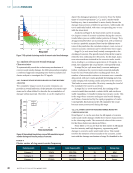
Thus, the ring count–center frequency combination can be
considered the optimal clustering combination for AE signals
from axial tensile failure in concrete. Given that the clustering
results for C1, C2, and C3 are highly consistent, Figure 7 can be
used to represent the final result.
1.0
1.2
1.4
0.8
0.6
0.4
0.2
0.0
a b c d e
Acoustic emission clustering combination
for axial damage of concrete
Coefficient of variation within the first type group
Coefficient of variation within the second type group
Coefficient of variation within the third type group
Coefficient of variation between groups
Figure 6. Coefficient variation within and between concrete groups.
TA B L E 4
Average number of iterations for clustering combinations of C1–C3 specimens
Clustering combination ASL–peak frequency (a) ASL–center frequency (b) ASL–ring count (c) Ring count–peak frequency (d) Ring count–center frequency (e)
Average number of
iterations 94 45 71 57 21
M AY 2 0 2 5 • M AT E R I A L S E V A L U AT I O N 47
C
ficient
of
variation
classify these highly correlated AE feature parameters.
From Figures 5a and 5b, it can be seen that the parame-
ter combinations of ASL–peak frequency and ASL–center fre-
quency in the clustering analysis demonstrate clear three-class
characteristics. Additionally, as shown in Table 3, the correla-
tion coefficients between these parameters are all greater than
0.5, validating the effectiveness of self-organizing clustering. In
terms of parameter interpretation, ASL represents the voltage
value of the AE signal, which is useful for evaluating continu-
ous AE activity and is sensitive to crack propagation, thus pro-
viding a measure for assessing the speed of crack growth [28].
The center frequency indicates the intensity of the AE event
and has some correlation with the energy release rate [29],
indirectly reflecting information about the rate of crack propa-
gation. Therefore, the clustering combination of ASL–peak fre-
quency and ASL–center frequency represents the rate of crack
propagation in concrete.
From Figures 5c, 5d, and 5e, the clustering analysis results
for the combinations of ASL–ring count, ring count–peak fre-
quency, and ring count–center frequency exhibit clear three-
class characteristics. Additionally, as shown in Table 3, the cor-
relation coefficients between these parameters are all greater
than 0.5, validating the effectiveness of self-organizing clus-
tering. From a parameter interpretation perspective, ASL and
ring count are time-domain parameters of AE, while center
frequency and peak frequency are frequency-domain param-
eters. This comprehensively encapsulates concrete damage
information from both time and frequency domains. Moreover,
these parameters can be used to evaluate AE activity and are
related to the distribution of material fracture strength, provid-
ing insights into assessing material fracture strength. Therefore,
the clustering combinations of ASL–ring count, ring count–
peak frequency, and ring count–center frequency represent the
fracture strength of concrete.
4.1.3. EVALUATION OF OPTIMAL CLUSTERING RESULTS
To further select the optimal clustering combination from the
five clustering combinations representing the damage infor-
mation of concrete, this study calculates the within-cluster and
between-cluster coefficients of variation for the five effective
clustering combinations labeled a to e. The calculation results
are shown in Figure 6.
As shown in Figure 6, the clustering combination labeled
“e” exhibits significant characteristics of intra-group and
inter-group variability. Specifically, the smaller intra-group
coefficient of variation indicates that the data within clusters
have high compactness and consistency, while the larger
inter-group coefficient of variation suggests strong separability
between different clusters. This characteristic demonstrates
that the ring count–center frequency combination can more
effectively capture the features of AE signals during the axial
tensile damage process in concrete, providing high discrimina-
tion capability.
Moreover, the correlation coefficient of clustering combina-
tion “e” is higher than those of other parameter combinations,
further validating the reasonableness and effectiveness of using
the coefficient of variation to assess clustering performance.
Finally, as time-frequency domain feature parameters of AE,
the ring count and center frequency not only comprehensively
reflect the AE characteristics of concrete at different damage
stages but also capture the dynamic changes in the damage
process across both time and frequency domains.
Additionally, Table 4 summarizes the number of iter-
ations for each clustering combination. From this, we can
see that the ring count–center frequency combination has
the fewest iterations, indicating that this combination has
a solid data foundation, enabling it to meet the cluster-
ing termination condition more quickly. At the same time,
the correlation analysis results show that the correlation
coefficient between ring count and center frequency is the
highest, suggesting that this combination has a high degree
of self-similarity, which aligns with the fact that it requires
the fewest iterations.
Thus, the ring count–center frequency combination can be
considered the optimal clustering combination for AE signals
from axial tensile failure in concrete. Given that the clustering
results for C1, C2, and C3 are highly consistent, Figure 7 can be
used to represent the final result.
1.0
1.2
1.4
0.8
0.6
0.4
0.2
0.0
a b c d e
Acoustic emission clustering combination
for axial damage of concrete
Coefficient of variation within the first type group
Coefficient of variation within the second type group
Coefficient of variation within the third type group
Coefficient of variation between groups
Figure 6. Coefficient variation within and between concrete groups.
TA B L E 4
Average number of iterations for clustering combinations of C1–C3 specimens
Clustering combination ASL–peak frequency (a) ASL–center frequency (b) ASL–ring count (c) Ring count–peak frequency (d) Ring count–center frequency (e)
Average number of
iterations 94 45 71 57 21
M AY 2 0 2 5 • M AT E R I A L S E V A L U AT I O N 47
C
ficient
of
variation