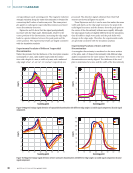
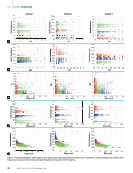
time history analysis. The second cluster has moderate inten-
sity and moderate frequency, indicating moderate damage,
with the primary phenomenon being the expansion of micro-
cracks in the concrete, matching the damage mechanism of
stage D2. The third cluster has low intensity and low frequency,
indicating severe damage, mainly due to the formation of mac-
roscopic cracks in the concrete, which aligns with the damage
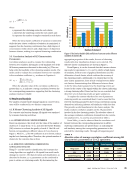
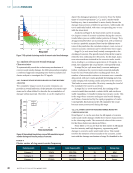
mechanism of stage D3. The cumulative hit count time history
curves for the three clusters are plotted in Figure 9, provid-
ing further validation for the classification of damage levels in
concrete.
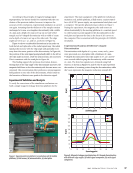
From Figure 9, it is evident that the cumulative hit count
time history curves for the three clustered results of concrete
acoustic emissions exhibit noticeable differences across the dif-
ferent damage stages. In stage D1, the AE activity represented
by the three time history curves tends to be consistent, indi-
cating a quiet period. In stage D2, the second and third types
of signals begin to show significant growth as the stress level
increases, with signals of moderate and severe damage over-
taking those of mild damage, gradually becoming dominant. In
stage D3, the AE activity of the third type of signal, representing
severe damage, increases significantly, becoming the dominant
signal in this stage.
In summary, the distribution of time history curves for the
three types of signals representing concrete damage levels after
clustering analysis shows dominance in their corresponding
damage stages. This further corroborates that the clustering
analysis results align with the AE characteristics of the three
damage stages described earlier.
4.2.3. JOINT ANALYSIS OF DAMAGE MECHANISMS
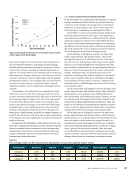
To further explore the comprehensive information on concrete
damage mechanisms hidden behind the optimal clustering
results, the study calculates the average values of AE feature
parameters corresponding to each cluster of the ring count–
center frequency combination, as summarized in Table 6.
From Table 6, it can be seen that the average values of the
AE feature parameters for the three types of AE signals have
noticeable numerical differences, confirming that the optimal
clustering combination chosen in this study effectively classi-
fies concrete axial tensile damage information. By examining
the differences in the average values of AE feature parameters,
this study explores the concrete damage mechanism informa-
tion underlying the three levels of damage severity.
In the first type of AE signal in concrete, the ring count,
energy, signal strength, and absolute energy, which repre-
sent signal intensity, are at relatively low levels. At the same
time, the rise time and duration, which represent the signal’s
duration, are at relatively high levels. This indicates that this
type of signal is characterized by low signal intensity and long
duration, typical of the quiet period in concrete axial tensile
damage. During this stage, the primary processes are the
expansion of existing cracks and the initiation of microcracks
in the concrete material. This can be identified as the signal
for the initiation of microcracks in concrete, consistent with
the characteristics of mild damage derived from the clustering
center analysis earlier.
In the second type of AE signal in concrete, the ring count,
energy, signal strength, and absolute energy, which represent
signal intensity, are at moderate levels. Additionally, the rise
time and duration, which indicate the signal’s duration, are also
at moderate levels. This suggests that this type of signal is char-
acterized by moderate signal intensity and duration. Thus, this
signal can be identified as representing the expansion of micro-
cracks in concrete, aligning with the characteristics of moderate
damage derived from the clustering center analysis earlier.
In the third type of AE signal in concrete, the ring count,
energy, signal strength, and absolute energy, which represent
signal intensity, are at relatively high levels. Meanwhile, the rise
time and duration, which indicate the signal’s duration, are
at relatively low levels. This suggests that this type of signal is
characterized by high signal intensity but a rapid rate of signal
decay, typical of strong excitation signals. Thus, this signal
can be identified as representing the cracking of macroscopic
cracks in concrete, consistent with the characteristics of severe
damage derived from the clustering center analysis earlier.
0
10001
5005
15001
D11
D2
D33 2000
2500
0 0.2 0.1 0.3 0.4 0.5 0.6 0.7 0.8 0.9 1.0
Time (normalized)
Category 1
Category 2
Category 3
0
0 2 0 0 3 0 4 0 5 0 6 0 0 8 0 9 0
y
ategory
Figure 9. Normalized time history curve of cumulative impact number
of three types of concrete AE signals.
TA B L E 6
The average values of AE characteristic parameters of concrete optimal cluster center
Clustering results Rise time (µs) Ring count Energy (pV-s) Duration (µs) Signal strength (pV-s) Absolute energy (aJ)
Category 1 36.14 2.36 0.06 473.35 2565.92 3.65
Category 2 14.51 7.02 0.32 65.58 1983.42 15.79
Category 3 8.81 37.02 6.34 39.79 42759.19 6404.17
M AY 2 0 2 5 • M AT E R I A L S E V A L U AT I O N 49
Accumulated
number
of AE
impacts
sity and moderate frequency, indicating moderate damage,
with the primary phenomenon being the expansion of micro-
cracks in the concrete, matching the damage mechanism of
stage D2. The third cluster has low intensity and low frequency,
indicating severe damage, mainly due to the formation of mac-
roscopic cracks in the concrete, which aligns with the damage
mechanism of stage D3. The cumulative hit count time history
curves for the three clusters are plotted in Figure 9, provid-
ing further validation for the classification of damage levels in
concrete.
From Figure 9, it is evident that the cumulative hit count
time history curves for the three clustered results of concrete
acoustic emissions exhibit noticeable differences across the dif-
ferent damage stages. In stage D1, the AE activity represented
by the three time history curves tends to be consistent, indi-
cating a quiet period. In stage D2, the second and third types
of signals begin to show significant growth as the stress level
increases, with signals of moderate and severe damage over-
taking those of mild damage, gradually becoming dominant. In
stage D3, the AE activity of the third type of signal, representing
severe damage, increases significantly, becoming the dominant
signal in this stage.
In summary, the distribution of time history curves for the
three types of signals representing concrete damage levels after
clustering analysis shows dominance in their corresponding
damage stages. This further corroborates that the clustering
analysis results align with the AE characteristics of the three
damage stages described earlier.
4.2.3. JOINT ANALYSIS OF DAMAGE MECHANISMS
To further explore the comprehensive information on concrete
damage mechanisms hidden behind the optimal clustering
results, the study calculates the average values of AE feature
parameters corresponding to each cluster of the ring count–
center frequency combination, as summarized in Table 6.
From Table 6, it can be seen that the average values of the
AE feature parameters for the three types of AE signals have
noticeable numerical differences, confirming that the optimal
clustering combination chosen in this study effectively classi-
fies concrete axial tensile damage information. By examining
the differences in the average values of AE feature parameters,
this study explores the concrete damage mechanism informa-
tion underlying the three levels of damage severity.
In the first type of AE signal in concrete, the ring count,
energy, signal strength, and absolute energy, which repre-
sent signal intensity, are at relatively low levels. At the same
time, the rise time and duration, which represent the signal’s
duration, are at relatively high levels. This indicates that this
type of signal is characterized by low signal intensity and long
duration, typical of the quiet period in concrete axial tensile
damage. During this stage, the primary processes are the
expansion of existing cracks and the initiation of microcracks
in the concrete material. This can be identified as the signal
for the initiation of microcracks in concrete, consistent with
the characteristics of mild damage derived from the clustering
center analysis earlier.
In the second type of AE signal in concrete, the ring count,
energy, signal strength, and absolute energy, which represent
signal intensity, are at moderate levels. Additionally, the rise
time and duration, which indicate the signal’s duration, are also
at moderate levels. This suggests that this type of signal is char-
acterized by moderate signal intensity and duration. Thus, this
signal can be identified as representing the expansion of micro-
cracks in concrete, aligning with the characteristics of moderate
damage derived from the clustering center analysis earlier.
In the third type of AE signal in concrete, the ring count,
energy, signal strength, and absolute energy, which represent
signal intensity, are at relatively high levels. Meanwhile, the rise
time and duration, which indicate the signal’s duration, are
at relatively low levels. This suggests that this type of signal is
characterized by high signal intensity but a rapid rate of signal
decay, typical of strong excitation signals. Thus, this signal
can be identified as representing the cracking of macroscopic
cracks in concrete, consistent with the characteristics of severe
damage derived from the clustering center analysis earlier.
0
10001
5005
15001
D11
D2
D33 2000
2500
0 0.2 0.1 0.3 0.4 0.5 0.6 0.7 0.8 0.9 1.0
Time (normalized)
Category 1
Category 2
Category 3
0
0 2 0 0 3 0 4 0 5 0 6 0 0 8 0 9 0
y
ategory
Figure 9. Normalized time history curve of cumulative impact number
of three types of concrete AE signals.
TA B L E 6
The average values of AE characteristic parameters of concrete optimal cluster center
Clustering results Rise time (µs) Ring count Energy (pV-s) Duration (µs) Signal strength (pV-s) Absolute energy (aJ)
Category 1 36.14 2.36 0.06 473.35 2565.92 3.65
Category 2 14.51 7.02 0.32 65.58 1983.42 15.79
Category 3 8.81 37.02 6.34 39.79 42759.19 6404.17
M AY 2 0 2 5 • M AT E R I A L S E V A L U AT I O N 49
Accumulated
number
of AE
impacts