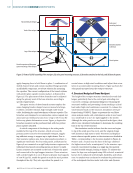
Liftoff and tilt inconsistencies often result from issues in
the reconstruction and registration of the virtual geometry for
path planning, such as misalignments between the virtual and
physical surface geometries. Additional factors include limita-
tions in the robot’s hardware and the synchronization between
the ECA data acquisition instrument and the robot. While
post-processing methods can help mitigate these errors and
improve defect detection, some defects may still be missed if
the errors exceed the algorithm’s corrective capacity.
Part Surface Reconstruction Error
Errors in the reconstructed surface of the test specimen can
arise from several sources. One common issue is the alignment
of the model, where misalignments lead to translation errors
along the scan path. If the model is not properly oriented with
its physical counterpart, rotation and liftoff variations will
occur throughout the entire scanning process. Another chal-
lenge is the discrepancy between the virtual model and the
physical surface geometry.
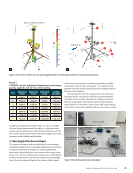
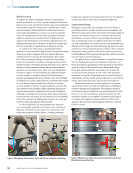
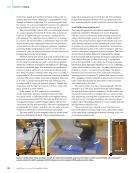
In this work, surface reconstruction of steel samples is
achieved using structured light with a CR-01 scanner offering
0.1 mm accuracy. However, metallic surfaces can reflect light,
causing inaccuracies during scanning, a problem that can be
mitigated using blue-light reconstruction (Zhan et al. 2015).
Additionally, errors may arise if the sample lies outside the
sensor’s effective range, affecting both translation and rotation.
Ray-plane intersection algorithms calculate translation and
rotation based on the mesh faces’ normal directions (Hamilton
et al. 2024).
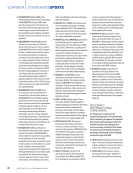
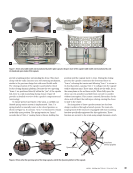
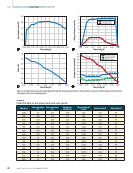
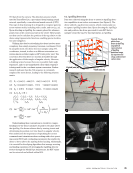
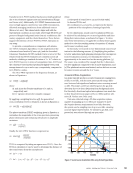
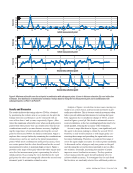
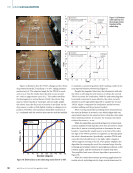
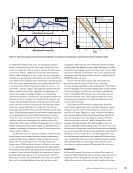
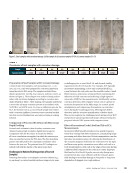
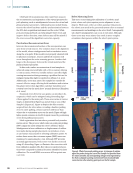
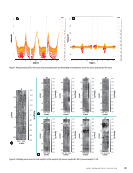
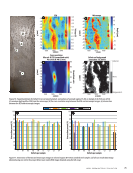
Rotational errors between scan points can introduce dis-
crepancies, which can be mitigated using detrending algo-
rithms applied to the raster path. These errors arise at various
stages, as illustrated in Figures 4a and 4b from a scan of flat
Sample A (Figure 3a). Figure 4a depicts the delta rotation
acquired from the robot alone, revealing a baseline pathing
error. In raster pathing, certain scan lines shift more than
others due to orientation errors on the mesh. Figure 4b high-
lights spatial variations in the ECA signal caused by positioning
errors from pathing inaccuracies.
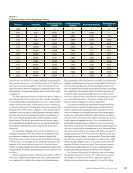
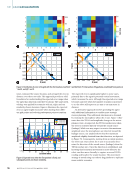
Mesh registration also introduces potential body transfor-
mation errors. The process, which relies on point-pair picking
(PPP), aligns the mesh within the robot’s reference frame.
Misalignment in laser calibration or displacement of calibra-
tion marks during sample placement can introduce errors,
as can human inaccuracies in selecting calibration points. To
reduce these errors, the root-mean-square (RMS) error was
minimized to approximately 1 mm. Although PPP provides
an initial approximation, body errors were further corrected
using 2D detrending. Figure 4c illustrates this correction with
four calibration markers (R0–R3), whose reconstructed posi-
tions were compared to physical locations identified via laser
calibration. The overall RMS error across all four points was
0.516 mm.
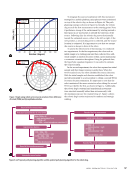
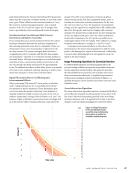
Robot Mastering Error
This error occurs during the calibration of a robotic arm’s
joints, where each joint requires precise alignment at zero
degrees. While state-of-the-art robots automate this process,
the robotic arm used in the presented system relies on manual
measurements and markings on the robot itself. Consequently,
sub-degree misalignments can occur at each joint. Although
these errors may seem minor, they result in more complex
orientation discrepancies within the robot’s joint system,
1010 1030
x (mm)
1050 1020 1040
—100
—50
R3 R0
R2 R1
0
50
100
—100
—50
0
50
100
0.9
1
0.8
0.7
0.6
0.5
0.4
0.3
0.2
0.1
0
x (mm)
0.3
0.2
0.1
0
—0.1
—0.2
Figure 4. Effects from mesh pathing errors: (a) changes of rotation
xyz of the probe during the scan of flat Sample A as provided from
the robot controller (b) corresponding voltage trend registered by
the ECA (c) aligned scanning environment from structured-light
reconstruction after selecting point pairs on the flat sample.
ME
|
ROBOTICECA
66
M AT E R I A L S E V A L U AT I O N • A P R I L 2 0 2 5
y
(mm)
y
(mm) Degree
V
(V)
the reconstruction and registration of the virtual geometry for
path planning, such as misalignments between the virtual and
physical surface geometries. Additional factors include limita-
tions in the robot’s hardware and the synchronization between
the ECA data acquisition instrument and the robot. While
post-processing methods can help mitigate these errors and
improve defect detection, some defects may still be missed if
the errors exceed the algorithm’s corrective capacity.
Part Surface Reconstruction Error
Errors in the reconstructed surface of the test specimen can
arise from several sources. One common issue is the alignment
of the model, where misalignments lead to translation errors
along the scan path. If the model is not properly oriented with
its physical counterpart, rotation and liftoff variations will
occur throughout the entire scanning process. Another chal-
lenge is the discrepancy between the virtual model and the
physical surface geometry.
In this work, surface reconstruction of steel samples is
achieved using structured light with a CR-01 scanner offering
0.1 mm accuracy. However, metallic surfaces can reflect light,
causing inaccuracies during scanning, a problem that can be
mitigated using blue-light reconstruction (Zhan et al. 2015).
Additionally, errors may arise if the sample lies outside the
sensor’s effective range, affecting both translation and rotation.
Ray-plane intersection algorithms calculate translation and
rotation based on the mesh faces’ normal directions (Hamilton
et al. 2024).
Rotational errors between scan points can introduce dis-
crepancies, which can be mitigated using detrending algo-
rithms applied to the raster path. These errors arise at various
stages, as illustrated in Figures 4a and 4b from a scan of flat
Sample A (Figure 3a). Figure 4a depicts the delta rotation
acquired from the robot alone, revealing a baseline pathing
error. In raster pathing, certain scan lines shift more than
others due to orientation errors on the mesh. Figure 4b high-
lights spatial variations in the ECA signal caused by positioning
errors from pathing inaccuracies.
Mesh registration also introduces potential body transfor-
mation errors. The process, which relies on point-pair picking
(PPP), aligns the mesh within the robot’s reference frame.
Misalignment in laser calibration or displacement of calibra-
tion marks during sample placement can introduce errors,
as can human inaccuracies in selecting calibration points. To
reduce these errors, the root-mean-square (RMS) error was
minimized to approximately 1 mm. Although PPP provides
an initial approximation, body errors were further corrected
using 2D detrending. Figure 4c illustrates this correction with
four calibration markers (R0–R3), whose reconstructed posi-
tions were compared to physical locations identified via laser
calibration. The overall RMS error across all four points was
0.516 mm.
Robot Mastering Error
This error occurs during the calibration of a robotic arm’s
joints, where each joint requires precise alignment at zero
degrees. While state-of-the-art robots automate this process,
the robotic arm used in the presented system relies on manual
measurements and markings on the robot itself. Consequently,
sub-degree misalignments can occur at each joint. Although
these errors may seem minor, they result in more complex
orientation discrepancies within the robot’s joint system,
1010 1030
x (mm)
1050 1020 1040
—100
—50
R3 R0
R2 R1
0
50
100
—100
—50
0
50
100
0.9
1
0.8
0.7
0.6
0.5
0.4
0.3
0.2
0.1
0
x (mm)
0.3
0.2
0.1
0
—0.1
—0.2
Figure 4. Effects from mesh pathing errors: (a) changes of rotation
xyz of the probe during the scan of flat Sample A as provided from
the robot controller (b) corresponding voltage trend registered by
the ECA (c) aligned scanning environment from structured-light
reconstruction after selecting point pairs on the flat sample.
ME
|
ROBOTICECA
66
M AT E R I A L S E V A L U AT I O N • A P R I L 2 0 2 5
y
(mm)
y
(mm) Degree
V
(V)