—40
—42
—44
—46
—48
—50
—52
—54
—56
—58
1030 1035 1040
—38
x (mm)
ECA
—40
—42
—44
—46
—48
—50
—52
—54
—56
—58
1030 1035 1040
—38
x (mm)
Microscope
0
—0.1
—0.2
—0.3
—0.4
—0.5
0.1
–5
—10
—15
—20
0
5
10
Defect int.
No int.
Background int.
15
20
0.2
0.3
0.4
0.5
—40
D4
D3
D2
D1
—42
—44
—46
—48
—50
—52
—54
—56
—58
1030 1035 1040
—38
x (mm)
Cross correlation
Max val: 0.539 (normalized units)
Pos [1035.8.-48.1] (mm)
—40
—42
—44
—46
—48
—50
—52
—54
—56
—58 1030 1035 1040
—38
x (mm)
Defect and background
interaction: 75.3895%
0
0.2
0.1
0.3
0.4
0.5
0.6
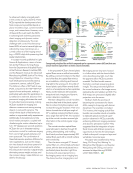
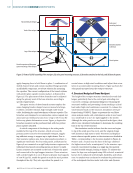
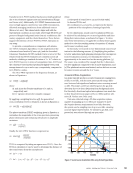
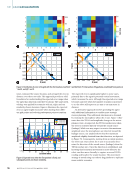
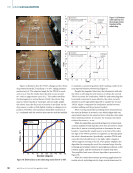
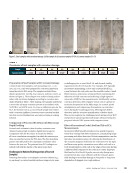
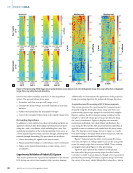
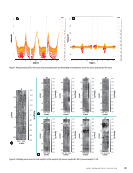
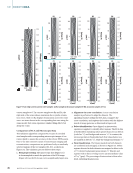
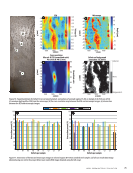
Figure 10. Experimental data for Defect D4 on corrosion Sample A: (a) locations of scanned regions D1–D4 on Sample A (b) ECA scan of D4
(c) corrosion depth profile of D4 from the microscope (d) the cross-correlation map between the ECA and microscopic images (e) intersection
between the ECA and microscopic images.
0
10
A B1 B2 B3 B4
Defects per sample
C1 C2 C3 C4
20
30
40
50
60
70
80
90
100
0
10
A B1 B2 B3 B4
Defects per sample
C1 C2 C3 C4
20
30
40
50
60
70
80
90
100
D1 D2 D3 D4 Not found
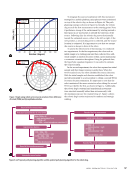
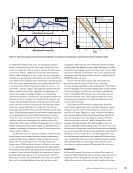
Figure 11. Intersection of the ECA and microscopic images in selected regions D1–D4 on corroded steel samples: (a) full scan results (ECA image
obtained using one coil in the array) (b) fast scan results (ECA image obtained using the full array).
A P R I L 2 0 2 5 • M AT E R I A L S E V A L U AT I O N 71
y
(mm)
y
(mm)
y
(mm)
y
(mm)
Intersection
percent
(%)
Intersection
percent
(%)
V
(V)
Depth
(μm)
Normalized
units
—42
—44
—46
—48
—50
—52
—54
—56
—58
1030 1035 1040
—38
x (mm)
ECA
—40
—42
—44
—46
—48
—50
—52
—54
—56
—58
1030 1035 1040
—38
x (mm)
Microscope
0
—0.1
—0.2
—0.3
—0.4
—0.5
0.1
–5
—10
—15
—20
0
5
10
Defect int.
No int.
Background int.
15
20
0.2
0.3
0.4
0.5
—40
D4
D3
D2
D1
—42
—44
—46
—48
—50
—52
—54
—56
—58
1030 1035 1040
—38
x (mm)
Cross correlation
Max val: 0.539 (normalized units)
Pos [1035.8.-48.1] (mm)
—40
—42
—44
—46
—48
—50
—52
—54
—56
—58 1030 1035 1040
—38
x (mm)
Defect and background
interaction: 75.3895%
0
0.2
0.1
0.3
0.4
0.5
0.6
Figure 10. Experimental data for Defect D4 on corrosion Sample A: (a) locations of scanned regions D1–D4 on Sample A (b) ECA scan of D4
(c) corrosion depth profile of D4 from the microscope (d) the cross-correlation map between the ECA and microscopic images (e) intersection
between the ECA and microscopic images.
0
10
A B1 B2 B3 B4
Defects per sample
C1 C2 C3 C4
20
30
40
50
60
70
80
90
100
0
10
A B1 B2 B3 B4
Defects per sample
C1 C2 C3 C4
20
30
40
50
60
70
80
90
100
D1 D2 D3 D4 Not found
Figure 11. Intersection of the ECA and microscopic images in selected regions D1–D4 on corroded steel samples: (a) full scan results (ECA image
obtained using one coil in the array) (b) fast scan results (ECA image obtained using the full array).
A P R I L 2 0 2 5 • M AT E R I A L S E V A L U AT I O N 71
y
(mm)
y
(mm)
y
(mm)
y
(mm)
Intersection
percent
(%)
Intersection
percent
(%)
V
(V)
Depth
(μm)
Normalized
units