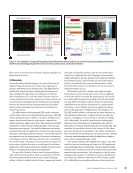
Ultimately, the DEF output depends on the use case. Both
single-defect and multi-defect use cases were evaluated to
test the robustness of the proposed model and loss function
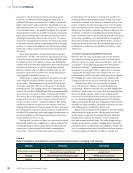
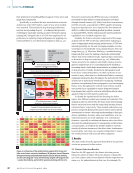
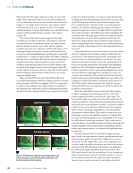
(Figure 7). For single-defect detection, the output is either
underextrusion (Class 1) or pristine (Class 0), as visually
verified in Figure 7a. In the multi-defect case, the DEF model
output includes underextrusion, pristine, and warping
(Figure 7b).
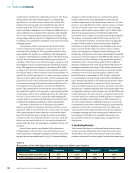
The results of the DEF model compared with single
modality (e.g., the best model with only images or only AE)
are discussed next. As mentioned earlier, the optimal deep
learning model for images was a CNN, and the optimal
model for the time-series data was a FFNN with dropout. The
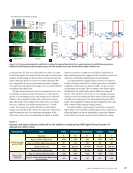
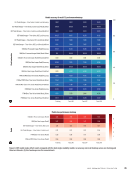
heatmap in Figure 8a presents a multi-model evaluation for
accuracy and recall, highlighting the performance of the DEF
model relative to single-modality models. The DEF, combining
AE time-series waveforms with deep learning methodologies,
outperformed others, achieving peak accuracy and perfect
recall for underextrusion defects across all test datasets. This
is evident in the high accuracy and recall values for the DEF
model with the custom loss function. The DEF model with the
BCE loss function also performed well however, the metric
range was slightly lower.
Moreover, the FFNN that used only AE data showed a
noticeable improvement when the synthetic minority oversam-
pling technique (SMOTE) was applied. SMOTE, an approach
to address class imbalance by synthesizing new examples in
the minority class, improved recall for underextrusion defects,
though it showed a modest decrease in accuracy and recall for
pristine (no defect) samples. In contrast, models based solely
on image data with deep learning showed lower accuracy and
recall. This disparity indicates a model that is highly sensi-
tive to underextrusion defects but fails to recognize pristine
instances. In addition, applying preprocessing techniques to
image data improved accuracy, though it did not remedy the
zero recall for pristine. The DEF model, which synergized AE
waveform data with image inputs, showcased high robustness
and performance metrics. This integration underscores the
efficacy of merging distinct data modalities using advanced
deep learning frameworks, resulting in a powerful model archi-
tecture capable of delivering precise, well-balanced predictive
outcomes.
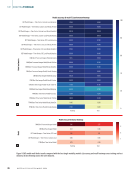
Along with the accuracy and recall metrics, the loss metrics
were also analyzed. The heatmap in Figure 8b illustrates the
performance of the deep learning models, measured by loss
metrics, across one training and three test datasets. The gra-
dation of red on the heatmap conveys the varying degrees of
loss across models and datasets, with darker hues signifying
higher loss. The DEF model combining AE with image data
notably outperforms others, maintaining negligible loss values
across all datasets, suggesting better predictive accuracy. In
contrast, the standalone CNN models, both with and without
preprocessing, incur substantially higher loss, especially on the
training set and the U18 dataset, indicating a less accurate fit.
The FFNN model exhibits moderate loss, while the incorpo-
ration of SMOTE does not yield any discernible benefit to the
model’s loss performance.
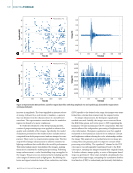
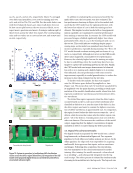
Next, the multi-defect case was evaluated. The heatmap
in Figure 9a displays the performance metrics of the DEF
model compared with the best models for each input. The
best overall results were achieved by the DEF model with the
custom loss function. This model demonstrated high accuracy
and recall rates across all classes. Notably, it achieved a perfect
recall rate of 100% for both the underextrusion and warping
defect classes, indicating a high ability to correctly identify
all instances of these defects. The model’s accuracy was 97%,
indicating it correctly identified the majority of samples. The
precision of identifying pristine cases was slightly lower at 95%,
but still reflected a robust performance. These results under-
score the efficacy of the DEF model in accurately detecting and
recalling multiple defects, particularly in identifying underex-
trusion and warping defects, as evidenced by high global and
local metrics.
Because false positives in this system trigger unneces-
sary closed-loop interventions, thereby wasting material and
time, precision and F1 are reported in addition to accuracy
and recall. For the single-defect case, each evaluation uses
50 defect and 50 nondefect frames as specified in the dataset
selection table. With this fixed class balance, the published
per-class recall values determine precision and F1 for the
DEF model trained with the custom loss. On the training set,
defect-class precision is 99.02% and defect-class F1 is 99.51%.
On the held-out tests U16, U17, and U18, defect-class preci-
sion is 98.04%, 98.05%, and 92.60%, and defect-class F1 is
ME
|
DIGITALTHREAD
Underextrusion
Single Defect Detection
Pristine
Underextrusion
Multi-Defect Detection
Warping Pristine
Figure 7. DEF detection output for (a) the single-defect case
(underextrusion vs. pristine) and (b) the multi-defect case
(underextrusion/pristine/warping).
44
M AT E R I A L S E V A L U AT I O N • J U LY 2 0 2 6
single-defect and multi-defect use cases were evaluated to
test the robustness of the proposed model and loss function
(Figure 7). For single-defect detection, the output is either
underextrusion (Class 1) or pristine (Class 0), as visually
verified in Figure 7a. In the multi-defect case, the DEF model
output includes underextrusion, pristine, and warping
(Figure 7b).
The results of the DEF model compared with single
modality (e.g., the best model with only images or only AE)
are discussed next. As mentioned earlier, the optimal deep
learning model for images was a CNN, and the optimal
model for the time-series data was a FFNN with dropout. The
heatmap in Figure 8a presents a multi-model evaluation for
accuracy and recall, highlighting the performance of the DEF
model relative to single-modality models. The DEF, combining
AE time-series waveforms with deep learning methodologies,
outperformed others, achieving peak accuracy and perfect
recall for underextrusion defects across all test datasets. This
is evident in the high accuracy and recall values for the DEF
model with the custom loss function. The DEF model with the
BCE loss function also performed well however, the metric
range was slightly lower.
Moreover, the FFNN that used only AE data showed a
noticeable improvement when the synthetic minority oversam-
pling technique (SMOTE) was applied. SMOTE, an approach
to address class imbalance by synthesizing new examples in
the minority class, improved recall for underextrusion defects,
though it showed a modest decrease in accuracy and recall for
pristine (no defect) samples. In contrast, models based solely
on image data with deep learning showed lower accuracy and
recall. This disparity indicates a model that is highly sensi-
tive to underextrusion defects but fails to recognize pristine
instances. In addition, applying preprocessing techniques to
image data improved accuracy, though it did not remedy the
zero recall for pristine. The DEF model, which synergized AE
waveform data with image inputs, showcased high robustness
and performance metrics. This integration underscores the
efficacy of merging distinct data modalities using advanced
deep learning frameworks, resulting in a powerful model archi-
tecture capable of delivering precise, well-balanced predictive
outcomes.
Along with the accuracy and recall metrics, the loss metrics
were also analyzed. The heatmap in Figure 8b illustrates the
performance of the deep learning models, measured by loss
metrics, across one training and three test datasets. The gra-
dation of red on the heatmap conveys the varying degrees of
loss across models and datasets, with darker hues signifying
higher loss. The DEF model combining AE with image data
notably outperforms others, maintaining negligible loss values
across all datasets, suggesting better predictive accuracy. In
contrast, the standalone CNN models, both with and without
preprocessing, incur substantially higher loss, especially on the
training set and the U18 dataset, indicating a less accurate fit.
The FFNN model exhibits moderate loss, while the incorpo-
ration of SMOTE does not yield any discernible benefit to the
model’s loss performance.
Next, the multi-defect case was evaluated. The heatmap
in Figure 9a displays the performance metrics of the DEF
model compared with the best models for each input. The
best overall results were achieved by the DEF model with the
custom loss function. This model demonstrated high accuracy
and recall rates across all classes. Notably, it achieved a perfect
recall rate of 100% for both the underextrusion and warping
defect classes, indicating a high ability to correctly identify
all instances of these defects. The model’s accuracy was 97%,
indicating it correctly identified the majority of samples. The
precision of identifying pristine cases was slightly lower at 95%,
but still reflected a robust performance. These results under-
score the efficacy of the DEF model in accurately detecting and
recalling multiple defects, particularly in identifying underex-
trusion and warping defects, as evidenced by high global and
local metrics.
Because false positives in this system trigger unneces-
sary closed-loop interventions, thereby wasting material and
time, precision and F1 are reported in addition to accuracy
and recall. For the single-defect case, each evaluation uses
50 defect and 50 nondefect frames as specified in the dataset
selection table. With this fixed class balance, the published
per-class recall values determine precision and F1 for the
DEF model trained with the custom loss. On the training set,
defect-class precision is 99.02% and defect-class F1 is 99.51%.
On the held-out tests U16, U17, and U18, defect-class preci-
sion is 98.04%, 98.05%, and 92.60%, and defect-class F1 is
ME
|
DIGITALTHREAD
Underextrusion
Single Defect Detection
Pristine
Underextrusion
Multi-Defect Detection
Warping Pristine
Figure 7. DEF detection output for (a) the single-defect case
(underextrusion vs. pristine) and (b) the multi-defect case
(underextrusion/pristine/warping).
44
M AT E R I A L S E V A L U AT I O N • J U LY 2 0 2 6