consistent data, the data was collected for one defect at a time.
To label the signals, an external clock was used to indicate time
markers corresponding to when a defect occurred the specific
layers where the defects occurred were known because they
were triggered by the previously mentioned printer changes.
Consequently, both signals and images were accurately labeled
according to the defect type.
The part instructions were sent to the printer via a G-code.
Accordingly, 18 datasets with overextrusion, 11 with underex-
trusion, 10 with stringing, and 3 with warping were collected
(Table 3). These datasets contain both optical and acoustic
data. The images were analyzed at a frame rate of one frame
every 10 s, resulting in a total processing time of ~1 h and
15 min. The frames were further filtered to remove blurry
images and only those that contain the specimen. The project
aimed to generate over 500 waveforms and images of the
defect area, with a focus on classifying this region. A smaller
dataset for pristine conditions was considered sufficient, as
these characteristics were captured in the nondefect sections of
other tests, facilitating comprehensive model training.
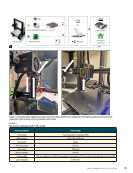
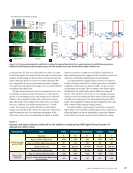
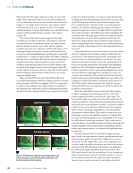
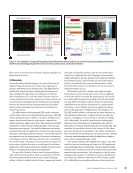
As a representative example, Figure 2b shows an underex-
trusion AE dataset with different feature projections, including
amplitude, peak frequency, signal strength, energy, rise time,
and duration across time. The red outline is the defect region.
Qualitatively, the defect region shows different average AE
feature values than the rest of the test. For example, the peak
frequency increases during the defect region, while the signal
strength and energy seem to be decreasing during the defect
region. This qualitative analysis provides insight into AE’s capa-
bility to detect defect regions during printing.
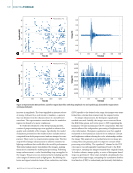
In further analysis, representative waveforms correspond-
ing to defect- and nondefect-related regions were compared, as
shown in Figures 3a and 3b. Specifically, a burst-like behavior
in the defect-associated waveform was identified by a sharp
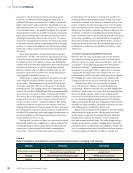
TA B L E 3
Acoustic and optical datasets collected for the additive-manufacturing (AM) digital thread (number of
datasets per defect class)
Sensing modality Metric Pristine Overextrusion Underextrusion Stringing Warping
Acoustic emission
sensor (33 dB)
Total tests 5 18 11 10 3
Avg. no. of hits in AE per test 1046 ~785 ~693 ~598 ~469
Avg. no. of hits in defect area per test 151 ~33 ~95 ~94 ~64
Range of hits in AE 1046 280–712 317–1041 340–974 360–560
Range of hits in defect area 151 2–81 33–124 16–194 43–101
Optical data
(camera)
Avg. no. of parsed frames per test ~500 ~497 ~450 ~448 ~444
Avg. no. of parsed frames in defect area
per test (useful) ~101 ~106 ~59 ~57 ~105
Time (s)
65
60
55
50
45
40
0 1000 2000 3000 4000
Time (s)
500
400
300
200
100
0 1000 2000 3000 4000
Time (s)
80000
60000
40000
20000
0
0 1000 2000 3000 4000
Time (s)
12
10
8
6
4
2
0
0 1000 2000 3000 4000
Underextrusion
Overextrusion Warping
Stringing
Overextrusion/
underextrusion/
stringing
Warping 5 mm
3D printed geometry and defects considered
26 mm
15 mm
Figure 2. (a) Test geometry designed for multi-defect tracking (b) representative dataset for an underextrusion test with AE feature projections
(amplitude, peak frequency, signal strength, energy, rise time, duration) versus time, with the defect region outlined in red.
J U LY 2 0 2 6 • M AT E R I A L S E V A L U AT I O N 37
Amplitude
(dB)
Peak
frequency
(kHz)
Signal
strength
(pV/s)
Energy
(aJ)
To label the signals, an external clock was used to indicate time
markers corresponding to when a defect occurred the specific
layers where the defects occurred were known because they
were triggered by the previously mentioned printer changes.
Consequently, both signals and images were accurately labeled
according to the defect type.
The part instructions were sent to the printer via a G-code.
Accordingly, 18 datasets with overextrusion, 11 with underex-
trusion, 10 with stringing, and 3 with warping were collected
(Table 3). These datasets contain both optical and acoustic
data. The images were analyzed at a frame rate of one frame
every 10 s, resulting in a total processing time of ~1 h and
15 min. The frames were further filtered to remove blurry
images and only those that contain the specimen. The project
aimed to generate over 500 waveforms and images of the
defect area, with a focus on classifying this region. A smaller
dataset for pristine conditions was considered sufficient, as
these characteristics were captured in the nondefect sections of
other tests, facilitating comprehensive model training.
As a representative example, Figure 2b shows an underex-
trusion AE dataset with different feature projections, including
amplitude, peak frequency, signal strength, energy, rise time,
and duration across time. The red outline is the defect region.
Qualitatively, the defect region shows different average AE
feature values than the rest of the test. For example, the peak
frequency increases during the defect region, while the signal
strength and energy seem to be decreasing during the defect
region. This qualitative analysis provides insight into AE’s capa-
bility to detect defect regions during printing.
In further analysis, representative waveforms correspond-
ing to defect- and nondefect-related regions were compared, as
shown in Figures 3a and 3b. Specifically, a burst-like behavior
in the defect-associated waveform was identified by a sharp
TA B L E 3
Acoustic and optical datasets collected for the additive-manufacturing (AM) digital thread (number of
datasets per defect class)
Sensing modality Metric Pristine Overextrusion Underextrusion Stringing Warping
Acoustic emission
sensor (33 dB)
Total tests 5 18 11 10 3
Avg. no. of hits in AE per test 1046 ~785 ~693 ~598 ~469
Avg. no. of hits in defect area per test 151 ~33 ~95 ~94 ~64
Range of hits in AE 1046 280–712 317–1041 340–974 360–560
Range of hits in defect area 151 2–81 33–124 16–194 43–101
Optical data
(camera)
Avg. no. of parsed frames per test ~500 ~497 ~450 ~448 ~444
Avg. no. of parsed frames in defect area
per test (useful) ~101 ~106 ~59 ~57 ~105
Time (s)
65
60
55
50
45
40
0 1000 2000 3000 4000
Time (s)
500
400
300
200
100
0 1000 2000 3000 4000
Time (s)
80000
60000
40000
20000
0
0 1000 2000 3000 4000
Time (s)
12
10
8
6
4
2
0
0 1000 2000 3000 4000
Underextrusion
Overextrusion Warping
Stringing
Overextrusion/
underextrusion/
stringing
Warping 5 mm
3D printed geometry and defects considered
26 mm
15 mm
Figure 2. (a) Test geometry designed for multi-defect tracking (b) representative dataset for an underextrusion test with AE feature projections
(amplitude, peak frequency, signal strength, energy, rise time, duration) versus time, with the defect region outlined in red.
J U LY 2 0 2 6 • M AT E R I A L S E V A L U AT I O N 37
Amplitude
(dB)
Peak
frequency
(kHz)
Signal
strength
(pV/s)
Energy
(aJ)