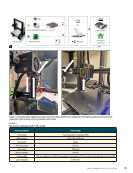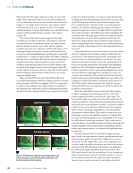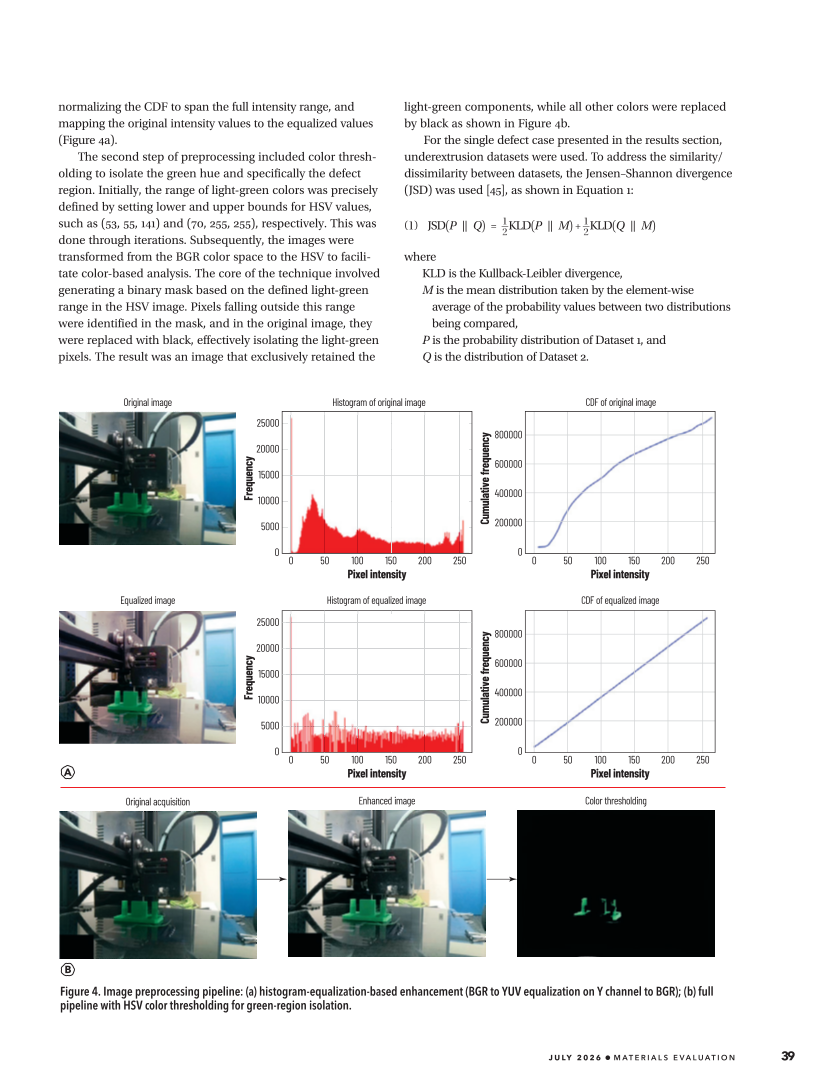
normalizing the CDF to span the full intensity range, and
mapping the original intensity values to the equalized values
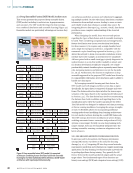
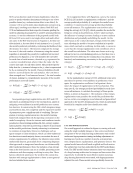
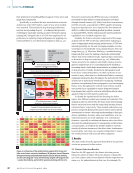
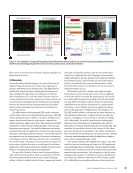
(Figure 4a).
The second step of preprocessing included color thresh-
olding to isolate the green hue and specifically the defect
region. Initially, the range of light-green colors was precisely
defined by setting lower and upper bounds for HSV values,
such as (53, 55, 141) and (70, 255, 255), respectively. This was
done through iterations. Subsequently, the images were
transformed from the BGR color space to the HSV to facili-
tate color-based analysis. The core of the technique involved
generating a binary mask based on the defined light-green
range in the HSV image. Pixels falling outside this range
were identified in the mask, and in the original image, they
were replaced with black, effectively isolating the light-green
pixels. The result was an image that exclusively retained the
light-green components, while all other colors were replaced
by black as shown in Figure 4b.
For the single defect case presented in the results section,
underextrusion datasets were used. To address the similarity/
dissimilarity between datasets, the Jensen–Shannon divergence
(JSD) was used [45], as shown in Equation 1:
(1) JSD(P ∥ Q) = 1
2
KLD(P ∥ M) + 1
2
KLD(Q ∥ M)
where
KLD is the Kullback-Leibler divergence,
M is the mean distribution taken by the element-wise
average of the probability values between two distributions
being compared,
P is the probability distribution of Dataset 1, and
Q is the distribution of Dataset 2.
Original image
Pixel intensity
25000
20000
15000
10000
5000
0
0 50 100 150 200 250
Histogram of original image
Pixel intensity
800000
600000
400000
200000
0
0 50 100 150 200 250
CDF of original image
Pixel intensity
25000
20000
15000
10000
5000
0
0 50 100 150 200 250
Histogram of equalized image
Pixel intensity
800000
600000
400000
200000
0
0 50 100 150 200 250
CDF of equalized image Equalized image
Original acquisition Enhanced image Color thresholding
Figure 4. Image preprocessing pipeline: (a) histogram-equalization-based enhancement (BGR to YUV equalization on Y channel to BGR) (b) full
pipeline with HSV color thresholding for green-region isolation.
J U LY 2 0 2 6 • M AT E R I A L S E V A L U AT I O N 39
Frequency
Cumulative
frequency
Frequency
Cumulative
frequency
mapping the original intensity values to the equalized values
(Figure 4a).
The second step of preprocessing included color thresh-
olding to isolate the green hue and specifically the defect
region. Initially, the range of light-green colors was precisely
defined by setting lower and upper bounds for HSV values,
such as (53, 55, 141) and (70, 255, 255), respectively. This was
done through iterations. Subsequently, the images were
transformed from the BGR color space to the HSV to facili-
tate color-based analysis. The core of the technique involved
generating a binary mask based on the defined light-green
range in the HSV image. Pixels falling outside this range
were identified in the mask, and in the original image, they
were replaced with black, effectively isolating the light-green
pixels. The result was an image that exclusively retained the
light-green components, while all other colors were replaced
by black as shown in Figure 4b.
For the single defect case presented in the results section,
underextrusion datasets were used. To address the similarity/
dissimilarity between datasets, the Jensen–Shannon divergence
(JSD) was used [45], as shown in Equation 1:
(1) JSD(P ∥ Q) = 1
2
KLD(P ∥ M) + 1
2
KLD(Q ∥ M)
where
KLD is the Kullback-Leibler divergence,
M is the mean distribution taken by the element-wise
average of the probability values between two distributions
being compared,
P is the probability distribution of Dataset 1, and
Q is the distribution of Dataset 2.
Original image
Pixel intensity
25000
20000
15000
10000
5000
0
0 50 100 150 200 250
Histogram of original image
Pixel intensity
800000
600000
400000
200000
0
0 50 100 150 200 250
CDF of original image
Pixel intensity
25000
20000
15000
10000
5000
0
0 50 100 150 200 250
Histogram of equalized image
Pixel intensity
800000
600000
400000
200000
0
0 50 100 150 200 250
CDF of equalized image Equalized image
Original acquisition Enhanced image Color thresholding
Figure 4. Image preprocessing pipeline: (a) histogram-equalization-based enhancement (BGR to YUV equalization on Y channel to BGR) (b) full
pipeline with HSV color thresholding for green-region isolation.
J U LY 2 0 2 6 • M AT E R I A L S E V A L U AT I O N 39
Frequency
Cumulative
frequency
Frequency
Cumulative
frequency