to power any AC devices. A notable challenge in this design is
the conversion from DC to AC and then back to DC, which can
lead to power losses through heat. However, this issue is mit-
igated by the fact that the equipment is primarily used to test
the feasibility of supporting multiple drones with off-the-shelf
components.
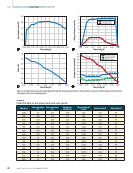
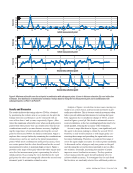
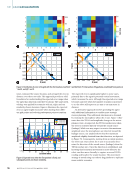
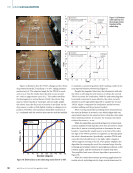
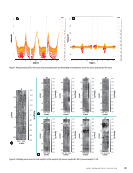
The first experiment aimed to evaluate the power output of
the solar panels over the course of a day. A single solar panel
was positioned flat at approximately 10:00 a.m., and the power
output was recorded every 15 min until 3:00 p.m., resulting in
a total of 30 data points. Plotting these data points against time
produced the results shown in Figure 6a. This data provides a
baseline for the amount of power generated around midday.
The next step involved assessing the power consumption of
the contact-based charging system while charging a single
drone battery. The device measured both the power output
and consumption during this process, and the resulting data
are plotted to illustrate the power usage of the system (see
Figure 6b).
The Skycharge charging system for drone batteries is an
intelligent charging system that adjusts the charging voltage
and current according to the drone battery’s charge level.
From Figure 6b, we can see that as the drone battery’s charge
level increases, the charging current gradually decreases. The
capacity of the drone battery is 3300 mAh. Once the drone
battery was fully charged, the system immediately stopped pro-
viding voltage. For better understanding, see the collected data
in Table 3.
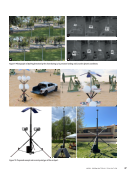
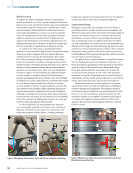
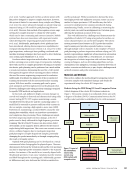
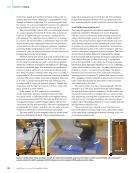
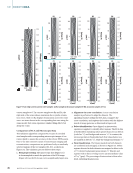
Before analyzing the data to estimate the number of drones
that can be supported throughout the day, a final experiment
was conducted to evaluate the system’s overall performance.
This experiment tested whether the controller could effectively
regulate an additional load connected in parallel to the battery.
For the setup and datasets collected during this experiment,
the solar panels were laid flat on the ground surface, providing
key insights into the system’s ability to handle varying power
demands while maintaining stable operation. Tables 2 and 3
show the collected data on the battery and solar panels, as well
as on the Skycharge device. The power, voltage, and current
data are shown in Figures 6c and 6d, respectively.
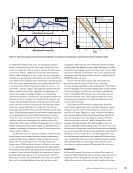
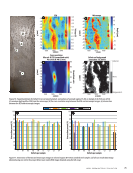
The results from the final experiment demonstrated that
the grid system is capable of supporting an additional load
while simultaneously charging a battery, provided the load
does not consume a substantial portion of the energy gener-
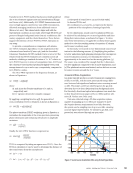
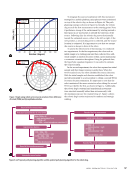
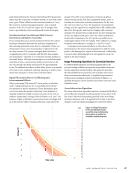
ated by the solar panels. Using the collected data, an estima-
tion was made to determine the number of drones the system
could support throughout the day. These calculations were
performed manually using a calculator. It was observed that
the battery could power the inverter until its charge dropped to
15%, but it could only be recharged up to 96%. During all trials,
the battery started with a 20% charge, and within one hour, its
charge increased at a rate of 50% per hour. Based on this data,
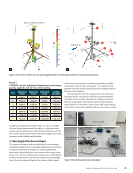
the graph shown in Figure 7 was generated. Given the conclu-
sion that the vertiport’s electrical grid can support up to eight
drones during daylight hours, it is recommended to limit the
number of drones to seven or fewer. This reduction ensures
sufficient power allocation for the main computing system,
maintaining optimal operational efficiency and stability.
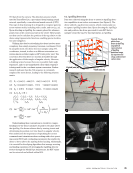
For this part of the study, the objective was to determine
the optimized number of drones the vertiport’s power bank
can support. The power bank has a capacity of 1280 Wh,
while each drone battery has a capacity of 48.84 Wh. Using
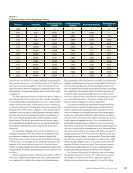
TA B L E 3
Collected data on the Skycharge device
Time (p.m.) Energy (Wh) Provided voltage (V) by
Skycharge
Provided current (A) by
Skycharge Drone battery charge (Ah) Drone battery level
(%)
12:50 0 0 0 0 0
1:00 0.39 14.25 3.6 0.034 1
1:05 5.8 15.933 5.009 0.376 11.4
1:10 14.7 16.27 5.009 0.918 27.82
1:15 18.542 16.322 5.009 1.154 34.97
1:20 25.996 16.345 5.009 1.62 49.09
1:25 31.609 16.634 5.009 1.971 59.73
1:30 40.056 16.79 4.374 2.501 75.79
1:35 45.899 16.79 2.864 2.835 85.91
1:40 48.86 16.764 1.997 2.999 90.88
1:45 50.776 16.764 1.466 3.122 94.61
1:50 52.286 16.764 0.952 3.206 97.15
1:55 53.537 16.764 0.582 3.285 99.55
2:00 53.985 16.764 0 3.312 100
A P R I L 2 0 2 5 • M AT E R I A L S E V A L U AT I O N 43
the conversion from DC to AC and then back to DC, which can
lead to power losses through heat. However, this issue is mit-
igated by the fact that the equipment is primarily used to test
the feasibility of supporting multiple drones with off-the-shelf
components.
The first experiment aimed to evaluate the power output of
the solar panels over the course of a day. A single solar panel
was positioned flat at approximately 10:00 a.m., and the power
output was recorded every 15 min until 3:00 p.m., resulting in
a total of 30 data points. Plotting these data points against time
produced the results shown in Figure 6a. This data provides a
baseline for the amount of power generated around midday.
The next step involved assessing the power consumption of
the contact-based charging system while charging a single
drone battery. The device measured both the power output
and consumption during this process, and the resulting data
are plotted to illustrate the power usage of the system (see
Figure 6b).
The Skycharge charging system for drone batteries is an
intelligent charging system that adjusts the charging voltage
and current according to the drone battery’s charge level.
From Figure 6b, we can see that as the drone battery’s charge
level increases, the charging current gradually decreases. The
capacity of the drone battery is 3300 mAh. Once the drone
battery was fully charged, the system immediately stopped pro-
viding voltage. For better understanding, see the collected data
in Table 3.
Before analyzing the data to estimate the number of drones
that can be supported throughout the day, a final experiment
was conducted to evaluate the system’s overall performance.
This experiment tested whether the controller could effectively
regulate an additional load connected in parallel to the battery.
For the setup and datasets collected during this experiment,
the solar panels were laid flat on the ground surface, providing
key insights into the system’s ability to handle varying power
demands while maintaining stable operation. Tables 2 and 3
show the collected data on the battery and solar panels, as well
as on the Skycharge device. The power, voltage, and current
data are shown in Figures 6c and 6d, respectively.
The results from the final experiment demonstrated that
the grid system is capable of supporting an additional load
while simultaneously charging a battery, provided the load
does not consume a substantial portion of the energy gener-
ated by the solar panels. Using the collected data, an estima-
tion was made to determine the number of drones the system
could support throughout the day. These calculations were
performed manually using a calculator. It was observed that
the battery could power the inverter until its charge dropped to
15%, but it could only be recharged up to 96%. During all trials,
the battery started with a 20% charge, and within one hour, its
charge increased at a rate of 50% per hour. Based on this data,
the graph shown in Figure 7 was generated. Given the conclu-
sion that the vertiport’s electrical grid can support up to eight
drones during daylight hours, it is recommended to limit the
number of drones to seven or fewer. This reduction ensures
sufficient power allocation for the main computing system,
maintaining optimal operational efficiency and stability.
For this part of the study, the objective was to determine
the optimized number of drones the vertiport’s power bank
can support. The power bank has a capacity of 1280 Wh,
while each drone battery has a capacity of 48.84 Wh. Using
TA B L E 3
Collected data on the Skycharge device
Time (p.m.) Energy (Wh) Provided voltage (V) by
Skycharge
Provided current (A) by
Skycharge Drone battery charge (Ah) Drone battery level
(%)
12:50 0 0 0 0 0
1:00 0.39 14.25 3.6 0.034 1
1:05 5.8 15.933 5.009 0.376 11.4
1:10 14.7 16.27 5.009 0.918 27.82
1:15 18.542 16.322 5.009 1.154 34.97
1:20 25.996 16.345 5.009 1.62 49.09
1:25 31.609 16.634 5.009 1.971 59.73
1:30 40.056 16.79 4.374 2.501 75.79
1:35 45.899 16.79 2.864 2.835 85.91
1:40 48.86 16.764 1.997 2.999 90.88
1:45 50.776 16.764 1.466 3.122 94.61
1:50 52.286 16.764 0.952 3.206 97.15
1:55 53.537 16.764 0.582 3.285 99.55
2:00 53.985 16.764 0 3.312 100
A P R I L 2 0 2 5 • M AT E R I A L S E V A L U AT I O N 43