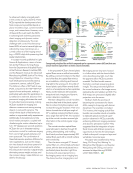
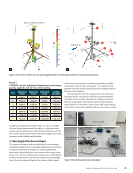
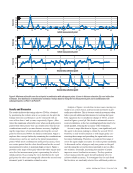
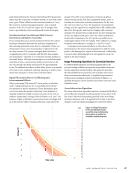
Results and Discussion
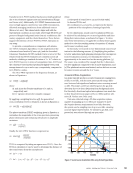
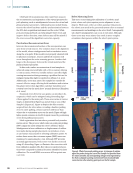
The results indicate that using only two TDOAs, obtained
by positioning the robotic arm at two points on the grid, the
leakage direction and distance can be estimated with an
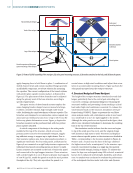
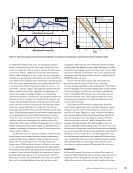
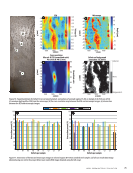
error of less than 1° and 40 mm, respectively. Figure 4 illus-
trates the minimum achievable error when each grid point is
paired with other points. One can clearly notice that not all
combinations result in 40 mm distance accuracy, highlight-
ing the importance of systematically selecting the second
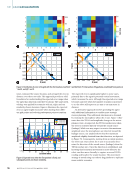
point for the second TDOA for distance estimation. Figure 4
explores this concept further by examining the combinations
when points 1 and 29 are used as the initial measurement
points. While most combinations yield good accuracy, there
are certain points that the robot should avoid as the second
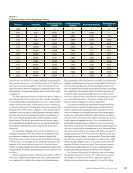
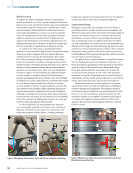
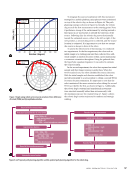
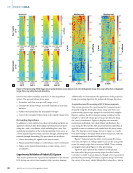
measurement location to maintain high accuracy. Figure 5
provides color maps of the grid, where the white square indi-
cates the first measurement point, representing the robot’s
initial position. By accessing the error distribution for each
grid point, the robot can strategically choose the second mea-
surement point to minimize estimation error.
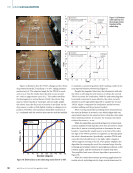
Analysis of Figure 5 reveals that, in most cases, moving ver-
tically is not a wise choice, and horizontal movement is gen-
erally more effective. This is because vertical movement often
fails to provide additional information for solving the hyper-
bolic equations due to insufficient change of TDOA, as indi-
cated in Figures 5c and 5d. This leads to substantial errors in
source localization, as the two resulting hyperbolas tend to be
nearly parallel, reducing the accuracy of the estimation.
Access to maps like those in Figure 5 can significantly aid
the agent in decision-making to obtain the second TDOA.
However, in real-world scenarios or with larger grids, con-
structing these maps and providing the agent with access
becomes challenging. Therefore, we explored the range of
errors the agent might encounter if it selects points randomly.
As discussed earlier, relying on only two points on the grid
and choosing the second location randomly is not an effec-
tive solution. Generally, increasing the number of points
improves source localization accuracy. The key question
is how many points the agent should randomly select to
achieve reliable accuracy. To investigate this, for each fixed
first location, we randomly selected two additional points 100
0
0
0.2
0.4
0.6
10 20 30
Second data collection point
40 50 60 70
0
0
0.2
0.1
10 20 30
Second data collection point
40 50 60 70
0
0
0.2
0.4
0.6
10 20 30
Initial measurement point
40 50 60
0
0.2
0.4
0.6
0.8
1.0
10 20 30
Initial measurement point
40 50 60
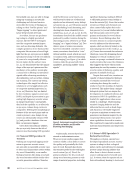
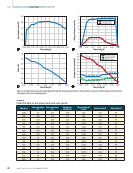
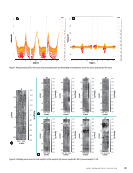
Figure 4. Minimum achievable error for each point in combination with subsequent points: (a) error in distance estimation (b) error in direction
estimation. Error distribution in leak distance estimation: Analysis based on fixing the first measurement point and its combinations with
subsequent points: (c) Point 1 (d) Point 29.
A P R I L 2 0 2 5 • M AT E R I A L S E V A L U AT I O N 55
Error
(m)
Error
(m)
Error
(m)
Error
(m)
The results indicate that using only two TDOAs, obtained
by positioning the robotic arm at two points on the grid, the
leakage direction and distance can be estimated with an
error of less than 1° and 40 mm, respectively. Figure 4 illus-
trates the minimum achievable error when each grid point is
paired with other points. One can clearly notice that not all
combinations result in 40 mm distance accuracy, highlight-
ing the importance of systematically selecting the second
point for the second TDOA for distance estimation. Figure 4
explores this concept further by examining the combinations
when points 1 and 29 are used as the initial measurement
points. While most combinations yield good accuracy, there
are certain points that the robot should avoid as the second
measurement location to maintain high accuracy. Figure 5
provides color maps of the grid, where the white square indi-
cates the first measurement point, representing the robot’s
initial position. By accessing the error distribution for each
grid point, the robot can strategically choose the second mea-
surement point to minimize estimation error.
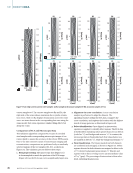
Analysis of Figure 5 reveals that, in most cases, moving ver-
tically is not a wise choice, and horizontal movement is gen-
erally more effective. This is because vertical movement often
fails to provide additional information for solving the hyper-
bolic equations due to insufficient change of TDOA, as indi-
cated in Figures 5c and 5d. This leads to substantial errors in
source localization, as the two resulting hyperbolas tend to be
nearly parallel, reducing the accuracy of the estimation.
Access to maps like those in Figure 5 can significantly aid
the agent in decision-making to obtain the second TDOA.
However, in real-world scenarios or with larger grids, con-
structing these maps and providing the agent with access
becomes challenging. Therefore, we explored the range of
errors the agent might encounter if it selects points randomly.
As discussed earlier, relying on only two points on the grid
and choosing the second location randomly is not an effec-
tive solution. Generally, increasing the number of points
improves source localization accuracy. The key question
is how many points the agent should randomly select to
achieve reliable accuracy. To investigate this, for each fixed
first location, we randomly selected two additional points 100
0
0
0.2
0.4
0.6
10 20 30
Second data collection point
40 50 60 70
0
0
0.2
0.1
10 20 30
Second data collection point
40 50 60 70
0
0
0.2
0.4
0.6
10 20 30
Initial measurement point
40 50 60
0
0.2
0.4
0.6
0.8
1.0
10 20 30
Initial measurement point
40 50 60
Figure 4. Minimum achievable error for each point in combination with subsequent points: (a) error in distance estimation (b) error in direction
estimation. Error distribution in leak distance estimation: Analysis based on fixing the first measurement point and its combinations with
subsequent points: (c) Point 1 (d) Point 29.
A P R I L 2 0 2 5 • M AT E R I A L S E V A L U AT I O N 55
Error
(m)
Error
(m)
Error
(m)
Error
(m)