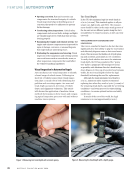
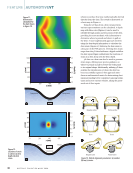
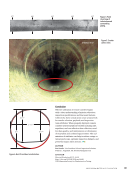
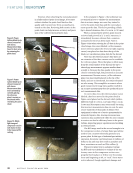
The penny test is a common method for deter-
mining whether the remaining tread depth meets
the minimum legal requirement. However, this
method is highly dependent on the user. A more
robust approach is to use a micrometer or depth
gauge (shown in Figure 2).
Because tires wear unevenly, to properly assess
if the remaining tread meets local legal require-
ments, multiple measurements should be taken
at various circumferential positions around the
tire and along each tread. Care must be taken to
ensure that the depth gauge is properly positioned
for accurate readings. Additionally, the depth gauge
must be calibrated to eliminate any systemic bias
that could affect the measurement results.
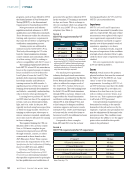
To determine if a measurement approach can
be used to meet a specific requirement, a gauge
study, specifically a Gage R&R (Repeatability and
Reproducibility) study, should be conducted. A
gauge study assesses the measurement system’s
overall performance via the following factors:
Ñ Repeatability (equipment variation). This
assesses whether the same operator can get consis-
tent measurements using the same depth gauge
on the same tire tread multiple times. Low repeat-
ability suggests that the gauge itself or the measure-
ment process introduces significant variability.
Ñ Reproducibility (operator variation). This
evaluates whether different operators can achieve
consistent measurements using the same depth
gauge on the same tire tread. High variability in
this area indicates differences in how operators
use the gauge or interpret its readings.
Ñ Overall measurement system variation. This
combines repeatability and reproducibility to
assess the total variation introduced by the
measurement system, encompassing both the
depth gauge and the operators.
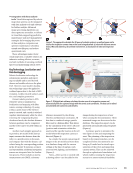
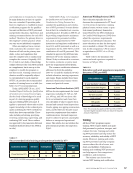
We conducted a gauge study on the use of
a depth gauge for tire tread measurement and
found that the operator contributed approximately
0.039 in. (1.0 mm) to the overall range of measure-
ments for a given tread. Therefore, to ensure that
the potential error introduced by the operator (the
auto mechanic) does not result in tires worn beyond
the legal limit being incorrectly assessed as passing,
the pass-fail measurement result must be adjusted
to account for this potential error (Figure 3).
To ensure a pass condition with a 95% con-
fidence interval, where the minimum legal tread
depth is 2/32 in., and considering the inherent
variability in measurements, we must account for
the uncertainty in the measurement process. This
involves adjusting the nominal pass threshold to
accommodate this measurement variability. By
doing so, we can be 95% confident that the true
tread depth does not fall below the minimum legal
limit.
The calculation entails determining the
standard deviation ( of a set of measurements and
using the Z-score associated with a 95% confidence
level. For a 95% confidence level, the Z-score is 1.96.
Because the range of measurements is 0.0394 in., if
we assume this range represents the total variability
(six standard deviations in a normal distribution, as
per the Six Sigma methodology), we can approxi-
mate the standard deviation as:
(1) σ = Range _
6
To ensure the measurement result meets the
minimum legal tread depth with a 95% confi-
dence interval, we adjust the threshold by adding
the margin of error (MoE) to the fail criteria. The
margin of error is calculated as:
(2) MoE =Z × σ
where
Z is the Z-score (1.96 for a 95% confidence level),
and
σ is the standard deviation.
To ensure a pass condition with a 95% confi-
dence interval, given a fail criteria of 2/32 in. and
a range of measurements of 0.0394 in., the mea-
surement result for tread depth must be at least
0.0755 in. This adjusted threshold accounts for
measurement variability and ensures, with 95%
confidence, that the true tread depth meets or
exceeds the legal minimum tread depth.
While the above approach ensures that the
tread of all tires measured with a depth gauge
meets the legal minimum, the significant variance
in the measurement process means that many tires
with tread measurements shallower than 0.0755 in.
may actually have true tread depths deeper than
the legal limit of 2/32 in. This means that tires
with remaining usable life might be discarded
unnecessarily.
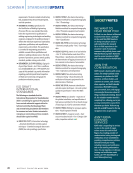
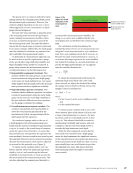
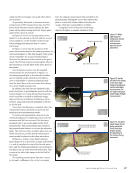
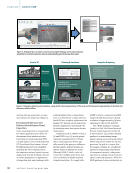
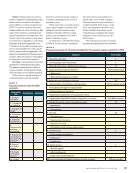
Pass with 95% confidence
Fail
Tread fail limit 0.0755 in.
based on GR&R results
Minimum legal tread
depth 0.0625 in.
Figure 3. The
impact of a visual
inspection on the
tread depth fail
limit.
J U L Y 2 0 2 4 • M A T E R I A L S E V A L U A T I O N 27
mining whether the remaining tread depth meets
the minimum legal requirement. However, this
method is highly dependent on the user. A more
robust approach is to use a micrometer or depth
gauge (shown in Figure 2).
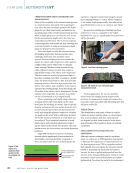
Because tires wear unevenly, to properly assess
if the remaining tread meets local legal require-
ments, multiple measurements should be taken
at various circumferential positions around the
tire and along each tread. Care must be taken to
ensure that the depth gauge is properly positioned
for accurate readings. Additionally, the depth gauge
must be calibrated to eliminate any systemic bias
that could affect the measurement results.
To determine if a measurement approach can
be used to meet a specific requirement, a gauge
study, specifically a Gage R&R (Repeatability and
Reproducibility) study, should be conducted. A
gauge study assesses the measurement system’s
overall performance via the following factors:
Ñ Repeatability (equipment variation). This
assesses whether the same operator can get consis-
tent measurements using the same depth gauge
on the same tire tread multiple times. Low repeat-
ability suggests that the gauge itself or the measure-
ment process introduces significant variability.
Ñ Reproducibility (operator variation). This
evaluates whether different operators can achieve
consistent measurements using the same depth
gauge on the same tire tread. High variability in
this area indicates differences in how operators
use the gauge or interpret its readings.
Ñ Overall measurement system variation. This
combines repeatability and reproducibility to
assess the total variation introduced by the
measurement system, encompassing both the
depth gauge and the operators.
We conducted a gauge study on the use of
a depth gauge for tire tread measurement and
found that the operator contributed approximately
0.039 in. (1.0 mm) to the overall range of measure-
ments for a given tread. Therefore, to ensure that
the potential error introduced by the operator (the
auto mechanic) does not result in tires worn beyond
the legal limit being incorrectly assessed as passing,
the pass-fail measurement result must be adjusted
to account for this potential error (Figure 3).
To ensure a pass condition with a 95% con-
fidence interval, where the minimum legal tread
depth is 2/32 in., and considering the inherent
variability in measurements, we must account for
the uncertainty in the measurement process. This
involves adjusting the nominal pass threshold to
accommodate this measurement variability. By
doing so, we can be 95% confident that the true
tread depth does not fall below the minimum legal
limit.
The calculation entails determining the
standard deviation ( of a set of measurements and
using the Z-score associated with a 95% confidence
level. For a 95% confidence level, the Z-score is 1.96.
Because the range of measurements is 0.0394 in., if
we assume this range represents the total variability
(six standard deviations in a normal distribution, as
per the Six Sigma methodology), we can approxi-
mate the standard deviation as:
(1) σ = Range _
6
To ensure the measurement result meets the
minimum legal tread depth with a 95% confi-
dence interval, we adjust the threshold by adding
the margin of error (MoE) to the fail criteria. The
margin of error is calculated as:
(2) MoE =Z × σ
where
Z is the Z-score (1.96 for a 95% confidence level),
and
σ is the standard deviation.
To ensure a pass condition with a 95% confi-
dence interval, given a fail criteria of 2/32 in. and
a range of measurements of 0.0394 in., the mea-
surement result for tread depth must be at least
0.0755 in. This adjusted threshold accounts for
measurement variability and ensures, with 95%
confidence, that the true tread depth meets or
exceeds the legal minimum tread depth.
While the above approach ensures that the
tread of all tires measured with a depth gauge
meets the legal minimum, the significant variance
in the measurement process means that many tires
with tread measurements shallower than 0.0755 in.
may actually have true tread depths deeper than
the legal limit of 2/32 in. This means that tires
with remaining usable life might be discarded
unnecessarily.
Pass with 95% confidence
Fail
Tread fail limit 0.0755 in.
based on GR&R results
Minimum legal tread
depth 0.0625 in.
Figure 3. The
impact of a visual
inspection on the
tread depth fail
limit.
J U L Y 2 0 2 4 • M A T E R I A L S E V A L U A T I O N 27