condition, pressure must be applied precisely to the
areas of deformation. Applying the right amount
of pressure in the correct location is necessary to
achieve a good result.
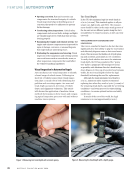
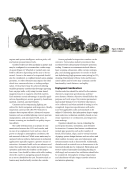
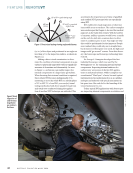
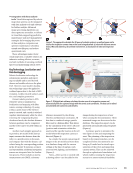
Applying the right pressure in the right direc-
tion along areas of the dent that are above the
original surface can relieve the strain in these
regions and cause other areas of the dent to move
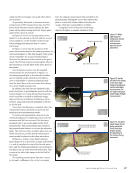
closer to their original, undamaged shape. Similarly,
pulling areas of the dent (Figure 7) that are below
the original surface has a comparable effect. By
combining pressure at high points (dent pounding)
with pressure at low points (dent pulling), the auto
mechanic can restore the body panel surface to a
close approximation of its original, undamaged state.
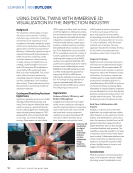
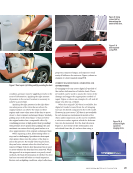
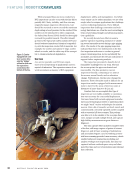
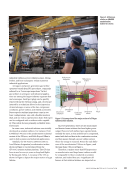
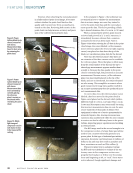
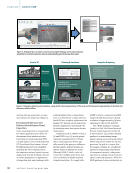
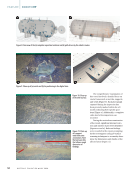
When repairing a dent, determining when to
stop can be challenging. Specialists in dent repair
often project lines onto the surface of the dent to
aid in this process. By visually observing the lines,
they can better estimate when the dent has been
removed. Figure 8 shows how line projection is used
to assess whether the dent has been removed. While
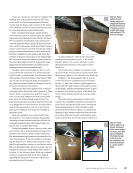
this approach is an improvement over purely visual
methods, the final determination of whether the dent
has been removed still relies on visual inspection.
Factors such as lighting conditions, object reflectance
properties, inspector fatigue, and inspector visual
acuity all influence the outcome. Figure 9 shows an
example of a dent repaired using PDR.
CURRENT MACHINE VISION CAPABILITIES AND
OPPORTUNITIES
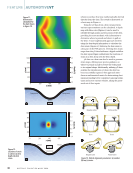
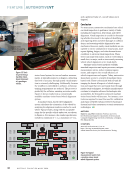
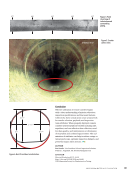
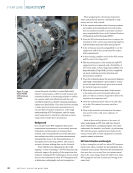
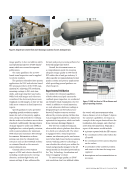
3D imaging tools can create digital 3D models of
the surface deformation of vehicle dents. These
3D models can be used to assess the extent of the
damage and suggest the appropriate method of
repair. Figure 10 shows an example of a 2D and 3D
image of a dent on a vehicle.
When the original CAD data is available, the
digital 3D model created from the 3D imaging
tool can be directly compared to the CAD model.
However, in most cases, CAD data is not available.
In such instances, mathematical models of the
object under inspection can be used to establish
a reference surface against which the deforma-
tion can be measured. For the dent shown in
Figure 10, the extent of the deformation was
calculated from the 3D surface data using a
Figure 8. Using
a visual aid for
determining the
extent of the dent.
Before After
Figure 9. A
dent repaired
using PDR.
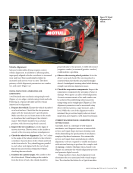
Figure 7. Dent repair: (a) Pulling and (b) pounding the dent.
Figure 10. A
structured light
system for
imaging dents.
J U L Y 2 0 2 4 • M A T E R I A L S E V A L U A T I O N 29
areas of deformation. Applying the right amount
of pressure in the correct location is necessary to
achieve a good result.
Applying the right pressure in the right direc-
tion along areas of the dent that are above the
original surface can relieve the strain in these
regions and cause other areas of the dent to move
closer to their original, undamaged shape. Similarly,
pulling areas of the dent (Figure 7) that are below
the original surface has a comparable effect. By
combining pressure at high points (dent pounding)
with pressure at low points (dent pulling), the auto
mechanic can restore the body panel surface to a
close approximation of its original, undamaged state.
When repairing a dent, determining when to
stop can be challenging. Specialists in dent repair
often project lines onto the surface of the dent to
aid in this process. By visually observing the lines,
they can better estimate when the dent has been
removed. Figure 8 shows how line projection is used
to assess whether the dent has been removed. While
this approach is an improvement over purely visual
methods, the final determination of whether the dent
has been removed still relies on visual inspection.
Factors such as lighting conditions, object reflectance
properties, inspector fatigue, and inspector visual
acuity all influence the outcome. Figure 9 shows an
example of a dent repaired using PDR.
CURRENT MACHINE VISION CAPABILITIES AND
OPPORTUNITIES
3D imaging tools can create digital 3D models of
the surface deformation of vehicle dents. These
3D models can be used to assess the extent of the
damage and suggest the appropriate method of
repair. Figure 10 shows an example of a 2D and 3D
image of a dent on a vehicle.
When the original CAD data is available, the
digital 3D model created from the 3D imaging
tool can be directly compared to the CAD model.
However, in most cases, CAD data is not available.
In such instances, mathematical models of the
object under inspection can be used to establish
a reference surface against which the deforma-
tion can be measured. For the dent shown in
Figure 10, the extent of the deformation was
calculated from the 3D surface data using a
Figure 8. Using
a visual aid for
determining the
extent of the dent.
Before After
Figure 9. A
dent repaired
using PDR.
Figure 7. Dent repair: (a) Pulling and (b) pounding the dent.
Figure 10. A
structured light
system for
imaging dents.
J U L Y 2 0 2 4 • M A T E R I A L S E V A L U A T I O N 29