There are caveats one can learn to mitigate with
training. Two critical ones are that the XYZ data
points used to achieve measurement data must
exactly map the shapes and contours of the surface
to be analyzed, and the measurement cursors must
be accurately placed on these data points.
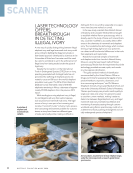
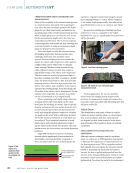
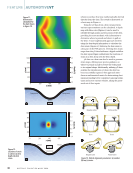
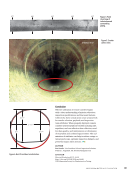
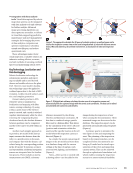
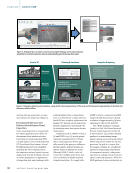
First, a measurement image captured with a
video borescope must accurately depict the underly-
ing measurement data determined by the calculated
XYZ coordinates, ensuring that each camera pixel
correctly maps the surface points. If the point cloud
data—all XYZ data points which are stitched together
to form a point cloud—precisely matches the surface
points, accurate measurements can be made using
the XYZ coordinates in that point cloud. Note that
in Figure 6 the point cloud data on the image’s right
side accurately depicts the surface points as seen in
the white light image on the left. Using point cloud
image data for measurements can result in more
accurate and precise measurement data.
Pivoting a point cloud image on the X, Y, and
Z axes allows the technician to evaluate the point
cloud’s health in other words, does the point cloud
data exactly portray the surface being viewed? This
can be done by pivoting the point cloud image on
the video borescope’s display or doing the same in
PC-based remeasurement software.
If the point cloud data quality is low, it will not
accurately depict the actual surface geometry. There
may be holes, or missing data, and there may be
wavy or extremely lumpy areas in the point cloud
even when the surface being imaged is flat. The
point cloud data must accurately represent the area
of an image that is to be measured. Accurate place-
ment of the measurement cursors is also critical
and can be validated, and relocated if needed, in
the point cloud.
Here are examples of two separate RVI tasks
showing how, even with good image data quality,
obtaining accurate measurement data yielded the
wrong measurement data. More importantly, we
will see how to resolve these errors.
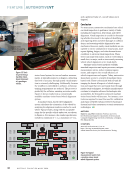
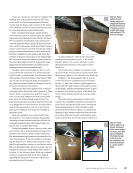
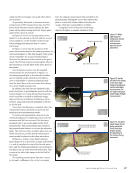
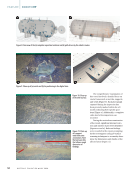
In the first example, Figure 7 shows a stereo mea-
surement of a tip-to-shroud clearance being used to
determine the wear of a power turbine’s blade tips.
The measurement type being used is referred to as a
depth measurement. It can be thought of as measur-
ing the distance to or from a reference plane estab-
lished by placing three cursors on a reference surface.
Then, by placing a fourth cursor on a point, one can
calculate the distance of that fourth cursor above (+)
or below (–) the reference plane. Blade tip-to-shroud
clearance is important data for decision-making
regarding the efficiency of the power turbine and
assessing the need for repairs.
As seen in Figure 7, three points of a math-
ematical reference plane appear to be on the
shroud’s surface: the cursors labeled 1,2, and 3.
(Pay particular attention to the plane’s cursor
labeled 3.)
The fourth cursor, labeled 4, is placed on the
tip of the blade and provides a measurement from
the reference plane on the shroud to the blade tip.
In Figure 7, the measurement data of 0.031 in.
(0.787 mm) may be considered accurate because
cursors 1, 2, and 3 for a reference plane appear on
the shroud (the darker surface in the upper portion
of the image), and the measurement cursor (cursor
4) appears to be placed on the tip of the blade (the
bronze-colored surface in the lower portion of the
image).
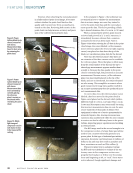
When the stereo measurement system does
not have the capability to generate a viewable 3D
point cloud, moving the fourth cursor around the
measurement plane can help establish a valid
placement of the reference plane, as indicated by
minimal, if any, distance variations from the refer-
ence plane. This step is often overlooked in stereo
measurements that do not offer a point cloud view.
White light image
IIV+
BLK
Point cloud image
Figure 6. Power
turbine shroud
(darker top part of
image) and blade tip
(bronzish lower part
of image) as seen in
a white light image
(left) and an XYZ 3D
point cloud (right).
IIV+
BLK MTD =0.855"
Tip of blade
1
3 4
2
+0.031"
Figure 7. Power
turbine blade tip-to-
shroud, measured
with a stereo image—
reference plane data
was not validated.
The darker top part
is the shroud of
the combustor the
bronzish lower part
is a power turbine
blade.
J U L Y 2 0 2 4 • M A T E R I A L S E V A L U A T I O N 45
CREDIT:
WAYGATE
TECHNOLOGIES
CREDIT:
WAYGATE
TECHNOLOGIES
training. Two critical ones are that the XYZ data
points used to achieve measurement data must
exactly map the shapes and contours of the surface
to be analyzed, and the measurement cursors must
be accurately placed on these data points.
First, a measurement image captured with a
video borescope must accurately depict the underly-
ing measurement data determined by the calculated
XYZ coordinates, ensuring that each camera pixel
correctly maps the surface points. If the point cloud
data—all XYZ data points which are stitched together
to form a point cloud—precisely matches the surface
points, accurate measurements can be made using
the XYZ coordinates in that point cloud. Note that
in Figure 6 the point cloud data on the image’s right
side accurately depicts the surface points as seen in
the white light image on the left. Using point cloud
image data for measurements can result in more
accurate and precise measurement data.
Pivoting a point cloud image on the X, Y, and
Z axes allows the technician to evaluate the point
cloud’s health in other words, does the point cloud
data exactly portray the surface being viewed? This
can be done by pivoting the point cloud image on
the video borescope’s display or doing the same in
PC-based remeasurement software.
If the point cloud data quality is low, it will not
accurately depict the actual surface geometry. There
may be holes, or missing data, and there may be
wavy or extremely lumpy areas in the point cloud
even when the surface being imaged is flat. The
point cloud data must accurately represent the area
of an image that is to be measured. Accurate place-
ment of the measurement cursors is also critical
and can be validated, and relocated if needed, in
the point cloud.
Here are examples of two separate RVI tasks
showing how, even with good image data quality,
obtaining accurate measurement data yielded the
wrong measurement data. More importantly, we
will see how to resolve these errors.
In the first example, Figure 7 shows a stereo mea-
surement of a tip-to-shroud clearance being used to
determine the wear of a power turbine’s blade tips.
The measurement type being used is referred to as a
depth measurement. It can be thought of as measur-
ing the distance to or from a reference plane estab-
lished by placing three cursors on a reference surface.
Then, by placing a fourth cursor on a point, one can
calculate the distance of that fourth cursor above (+)
or below (–) the reference plane. Blade tip-to-shroud
clearance is important data for decision-making
regarding the efficiency of the power turbine and
assessing the need for repairs.
As seen in Figure 7, three points of a math-
ematical reference plane appear to be on the
shroud’s surface: the cursors labeled 1,2, and 3.
(Pay particular attention to the plane’s cursor
labeled 3.)
The fourth cursor, labeled 4, is placed on the
tip of the blade and provides a measurement from
the reference plane on the shroud to the blade tip.
In Figure 7, the measurement data of 0.031 in.
(0.787 mm) may be considered accurate because
cursors 1, 2, and 3 for a reference plane appear on
the shroud (the darker surface in the upper portion
of the image), and the measurement cursor (cursor
4) appears to be placed on the tip of the blade (the
bronze-colored surface in the lower portion of the
image).
When the stereo measurement system does
not have the capability to generate a viewable 3D
point cloud, moving the fourth cursor around the
measurement plane can help establish a valid
placement of the reference plane, as indicated by
minimal, if any, distance variations from the refer-
ence plane. This step is often overlooked in stereo
measurements that do not offer a point cloud view.
White light image
IIV+
BLK
Point cloud image
Figure 6. Power
turbine shroud
(darker top part of
image) and blade tip
(bronzish lower part
of image) as seen in
a white light image
(left) and an XYZ 3D
point cloud (right).
IIV+
BLK MTD =0.855"
Tip of blade
1
3 4
2
+0.031"
Figure 7. Power
turbine blade tip-to-
shroud, measured
with a stereo image—
reference plane data
was not validated.
The darker top part
is the shroud of
the combustor the
bronzish lower part
is a power turbine
blade.
J U L Y 2 0 2 4 • M A T E R I A L S E V A L U A T I O N 45
CREDIT:
WAYGATE
TECHNOLOGIES
CREDIT:
WAYGATE
TECHNOLOGIES