Ñ Integration with data analysis
tools. Visual data captured by robotic
inspection systems can be integrated
with data analysis tools and software
for further analysis. Advanced
image-processing algorithms can
detect patterns, anomalies, or defects
in visual data, supporting predictive
maintenance and asset management
strategies. By leveraging the power
of data analytics, companies can
optimize maintenance schedules,
extend asset lifespan, and reduce
operational costs.
These advantages make robotic
visual inspection a valuable solution for
industries seeking efficient, accurate,
and safe methods of assessing confined
spaces and maintaining critical assets.
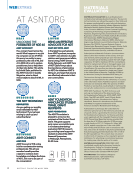
Key Technology: Localization and
Data Geotagging
Robotic localization technology for
autonomous operation and report-
ing is available and is used by both
drones and mobile robots on the plant
level. However, most modern localiza-
tion technology cannot be applied to
confined spaces due to the lack of GPS
reception, weakly textured surfaces, asset
size, and complex geometries.
Current robotic practice in GPS-
restrictive areas is simultaneous
localization and mapping with lidar
remote sensing technology. By using
a lidar, a point cloud of the environ-
ment is created, and a mesh is stitched
together simultaneously while the robot
is moving. By comparing the point
clouds and mesh, the absolute distance
between positions can be computed,
and the robot can be located within an
asset.
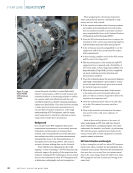
Another much simpler approach is
to provide a 3D model of the asset as
input, measure the distance from the
robot to a specific point on the asset,
and compare this with the distance cal-
culated using the corresponding position
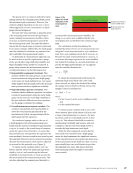
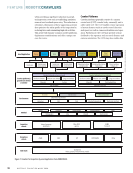
in the 3D model. To increase accuracy
and repeatability, additional navigation
sensors are integrated into the localiza-
tion process. These include an inertia
measurement unit (IMU), odometry
(distance measured by the driving
wheels), and kinematic constraints. All
this data is combined using a particle
filter and/or a Kalman filter. This allows
for the calculation of the robot’s 3D pose
(position and orientation within the
asset) and the specific location in the 3D
model where the inspection camera is
directed (Figure 2).
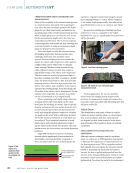
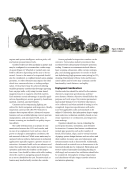
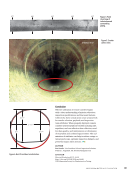
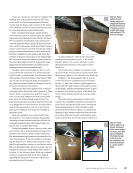
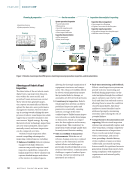
As a result, the system can geotag all
images to the 3D model and store them
in a database along with the camera
settings at the time of capture, such
as zoom level, lighting, and resolution
(Figure 3).
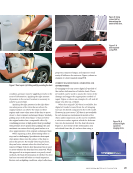
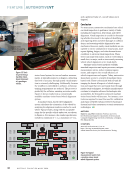
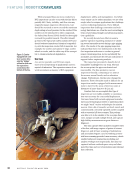
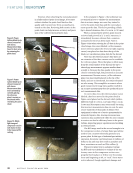
Notes—either as text or created with
a drawing editor—can be added to the
images during the inspection or later
when creating the documentation. These
annotated images are then stored in the
database. The inspection report can be
generated automatically using templates
(Figure 4).
A primary goal is to minimize the
time spent on-site and inspecting the
asset. The planning of the inspection,
based on the inspection plan, can be
completed before the mission by uti-
lizing a 3D model and a virtual repre-
sentation of the robot and inspection
camera system. This can be achieved
through a sophisticated simulation tool,
which enables running the inspection
scenario to assess technical feasibility
Area under
inspection
x x
y
y
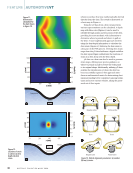
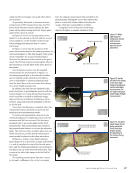
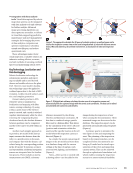
Figure 2. The approach to calculate the 3D pose of a robotic system in a confined space and to
localize the inspection camera view on the asset being observed: (a) robot with distance sensors
(lidar), IMU, and odometry (b) confined environment (c) localization of robot and inspection
data.
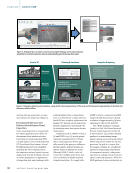
Data point
selected
Camera cone
Inspection
data (visual
inspection)
Figure 3. 3D digital twin software calculates the view cone of an inspection camera and
automatically links the captured image with the correct asset coordinates. The data can be edited
and amended with comments and sketches.
J U L Y 2 0 2 4 • M A T E R I A L S E V A L U A T I O N 51
tools. Visual data captured by robotic
inspection systems can be integrated
with data analysis tools and software
for further analysis. Advanced
image-processing algorithms can
detect patterns, anomalies, or defects
in visual data, supporting predictive
maintenance and asset management
strategies. By leveraging the power
of data analytics, companies can
optimize maintenance schedules,
extend asset lifespan, and reduce
operational costs.
These advantages make robotic
visual inspection a valuable solution for
industries seeking efficient, accurate,
and safe methods of assessing confined
spaces and maintaining critical assets.
Key Technology: Localization and
Data Geotagging
Robotic localization technology for
autonomous operation and report-
ing is available and is used by both
drones and mobile robots on the plant
level. However, most modern localiza-
tion technology cannot be applied to
confined spaces due to the lack of GPS
reception, weakly textured surfaces, asset
size, and complex geometries.
Current robotic practice in GPS-
restrictive areas is simultaneous
localization and mapping with lidar
remote sensing technology. By using
a lidar, a point cloud of the environ-
ment is created, and a mesh is stitched
together simultaneously while the robot
is moving. By comparing the point
clouds and mesh, the absolute distance
between positions can be computed,
and the robot can be located within an
asset.
Another much simpler approach is
to provide a 3D model of the asset as
input, measure the distance from the
robot to a specific point on the asset,
and compare this with the distance cal-
culated using the corresponding position
in the 3D model. To increase accuracy
and repeatability, additional navigation
sensors are integrated into the localiza-
tion process. These include an inertia
measurement unit (IMU), odometry
(distance measured by the driving
wheels), and kinematic constraints. All
this data is combined using a particle
filter and/or a Kalman filter. This allows
for the calculation of the robot’s 3D pose
(position and orientation within the
asset) and the specific location in the 3D
model where the inspection camera is
directed (Figure 2).
As a result, the system can geotag all
images to the 3D model and store them
in a database along with the camera
settings at the time of capture, such
as zoom level, lighting, and resolution
(Figure 3).
Notes—either as text or created with
a drawing editor—can be added to the
images during the inspection or later
when creating the documentation. These
annotated images are then stored in the
database. The inspection report can be
generated automatically using templates
(Figure 4).
A primary goal is to minimize the
time spent on-site and inspecting the
asset. The planning of the inspection,
based on the inspection plan, can be
completed before the mission by uti-
lizing a 3D model and a virtual repre-
sentation of the robot and inspection
camera system. This can be achieved
through a sophisticated simulation tool,
which enables running the inspection
scenario to assess technical feasibility
Area under
inspection
x x
y
y
Figure 2. The approach to calculate the 3D pose of a robotic system in a confined space and to
localize the inspection camera view on the asset being observed: (a) robot with distance sensors
(lidar), IMU, and odometry (b) confined environment (c) localization of robot and inspection
data.
Data point
selected
Camera cone
Inspection
data (visual
inspection)
Figure 3. 3D digital twin software calculates the view cone of an inspection camera and
automatically links the captured image with the correct asset coordinates. The data can be edited
and amended with comments and sketches.
J U L Y 2 0 2 4 • M A T E R I A L S E V A L U A T I O N 51