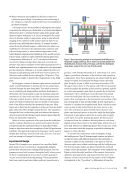
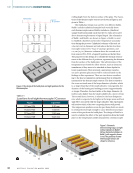
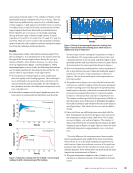
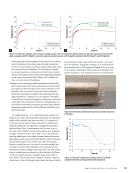
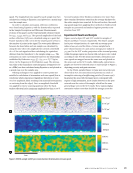
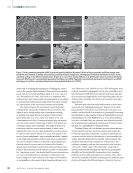
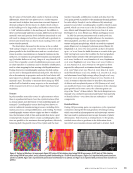
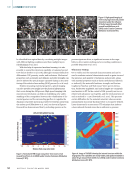
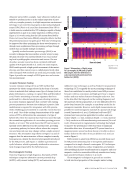
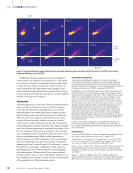
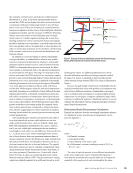
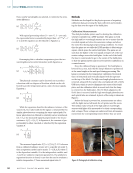
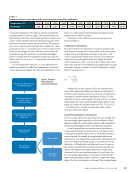
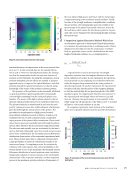
The temperature drops exponentially with distance, such that little difference is measured between the other three Z positions. Higher temperatures are measured at all Z positions for the small-diameter cylinders. This suggests that heat dissipation through the large cylinders is a prevalent factor due to the larger mass of heat-conductive material than that in small cylinders. One might expect the opposite effect because the laser heat source dwells longer at the larger-diameter components. However, it may also be argued that regardless of the position of the laser during the melting process, over large or small cylindrical components, the temperature of the entire build plate is increasing. Generally speaking, the same principals and behavior apply during the process for Build 2. The different configura- tion of Build 2 results in a few differences in the temperature profile, including the following observations: Because of the horizontal configuration of Build 2, the heat source remains close to the build plate in comparison with the vertical design of Build 1. Therefore, more heat flows to the build plate. Also, because of the horizontal configuration, the cross- sectional area and duration of the laser melting process varies with height. The melt process reaches approximately 8 min (480 s) for the mid layers, versus a constant 60 s for Build 1. This results in longer melt times, fewer pauses, and higher temperature accumulations in comparison to Build 1. All four cylinders are identical in geometry. The measured temperatures are expected to be the same for each pair of sensors of the same Z position, which are located under the two ends of the same cylinder. TC1 and TC5 are expected to measure higher temperatures than the remaining thermo- couple sensors. However, the cylinder above TC5 separated from the build plate during the fourth hour, before reaching what would have been its peak temperature. Therefore, the temperature measured by TC5 is significantly lower than TC1. The remaining sensors reached their maximum readings between 5 and 10 h. The temperature reading for each pair is similar but not identical, which may be attributed to the time each cylinder edge separated from the build plate. This is reflected in the profiles shown in Figure 7. As shown in Figure 8, all four cylindrical rods showed a significant amount of liftoff from the build plate around both edges, where residual stress accumulation is the highest. At the start of the melt process, the top layer is extremely hot while the inner and bottom parts of the cylinder are rela- tively cold. When the laser is idle, heat transfers from the top 0.38 0.76 1.14 1.52 75 80 Z position (cm) 70 65 60 55 50 TC5 TC6 TC7 TC8 TC4 TC3 TC2 TC1 Large cylinders Small cylinders Figure 6. Peak temperatures experienced at each thermocouple location during Build 1. 0.38 0.76 1.14 1.52 75 80 Z position (cm) 70 65 60 55 50 TC5 TC6 TC7 TC8 TC4 TC3 TC2 TC1 Large cylinders Small cylinders Figure 7. Peak temperatures experienced at each thermocouple location during Build 2. Cooling creates internal tensile force near top surface from material contraction Heat flow downward prevents internal tensile force from building up near the part bottom Figure 8. Deformation of cylinders due to residual stresses. Net forces cause the edges to curl upward. ME | THERMOCOUPLEMONITORING 34 M A T E R I A L S E V A L U A T I O N • A P R I L 2 0 2 2 Peatemperature(°) k Peatemperature(°) k

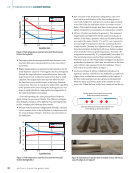
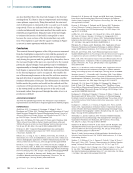
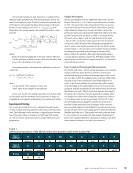
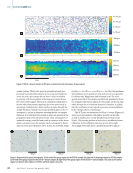
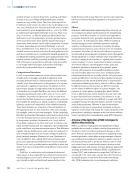
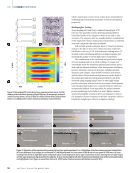
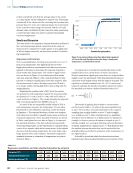
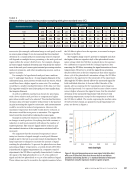
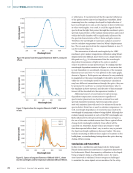
to the inner parts of the cylinder. As the top part cools down, heat is transferred to the lower layers through conduction. The lower layers remain at elevated temperatures longer and are restrained by the build plate. The bottom part, unable to expand, experiences compression while the top is under tension. The residual stresses from this temperature gradient reach a point that breaks off the edges of the cylinders as they curl away from the build plate. Figure 9 shows that the gradual separation from the build plate causes a slow drop in the temperature as measured by the respective thermocouple sensor. Heat continues to flow laterally to the sensor from other parts of the build plate. When the separation is complete, the temperature drop is approximately 5 °C, lasting 2 to 3 h in duration. The extent and duration of the drop is perhaps a reflection on the extent and length of the separation. However, this hypothesis was not tested in this study because the geometry and resultant thermal measurements for all the cylinders in Build 2 were relatively similar. To confirm that the ~5 °C temperature drop observed in Figure 9 is a result of the build plate separation, the deformed profile of the cylinder edge that was above TC1 is analyzed. As the part is built layer by layer vertically, the undistorted cylinder should have an edge that is straight and normal to the build plate. Prior to deformation, the “bottom” part of the edge of the cylinder is built in this manner (see markings in Figure 10). Between the “start” and “end” of the deforma- tion, the middle part of the edge becomes slanted or curved, depending on the nature of the deformation. The bottom part, already built, begins to lift off and curl under the accumu- lation of residual stresses. As a result, it remains straight but no longer normal to the build plate. Once residual stresses are relieved and the curling action stops, the “top” part of the edge is straight again and normal to the build plate. In Figure 10, lines are drawn along an enlarged image of the edge of the cylinder. The fraction of the length for each line segment with respect to the total length can estimate the time at which the deformation began and ended with respect to the total 28.36 h build time. Using this technique, it is estimated that the separation above TC1 began and ended at the 10.04 and 12.72 h marks, respectively. These marks are identified with squares in Figure 11. The beginning and end of deformation Figure 9. Temperature readings, with a 12-point moving average, from TC1 and TC3 for Build 2, where the specimen separated from the build plate, compared with TC1 of Build 1, where the specimen did not separate: (a) TC1 (Build 1 and Build 2) (b) TC1 (Build 1) and TC3 (Build 2). 70 60 50 40 30 20 0 5 10 15 Temperature drop d p n 20 25 30 80 Time (h) 2 (Build ) 2 70 60 50 40 30 20 0 5 10 15 Temperature dropp 20 25 30 80 Time (h) 2 (Build ) 2 due to separation TC1 (Build 1) averag e TC1 averag e due to separationp TC1 (Build 1) averag e TC3 averag e Bottom Top Start End Figure 10. Deformation profile and separation of cylinder edge from build plate. 60 61 62 63 64 65 66 67 68 69 16 14 12 10 8 Time (h) Figure 11. Closeup of temperature readings from TC1 for Build 2 around the time the part separated from the build plate. A P R I L 2 0 2 2 • M A T E R I A L S E V A L U A T I O N 35 T (°) T (°) T (°)
ASNT grants non-exclusive, non-transferable license of this material to  .
All rights reserved. © ASNT 2026. To report unauthorized use, contact: customersupport@asnt.org