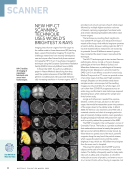
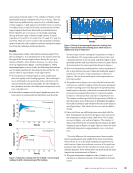
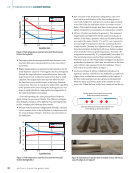
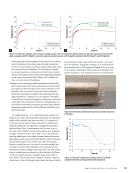
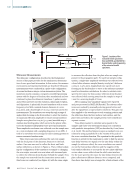
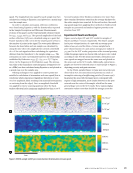
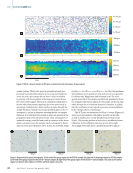
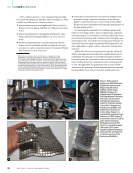
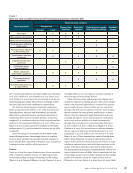
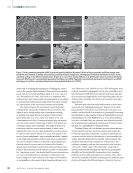
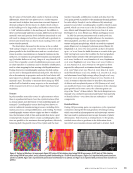
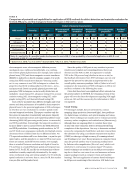
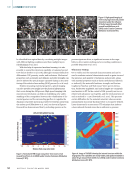
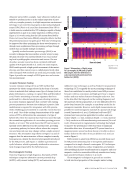
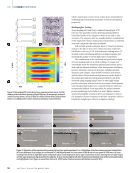
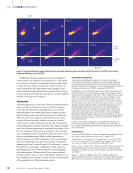
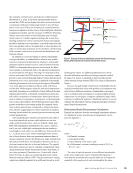
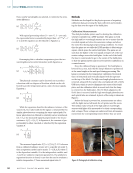
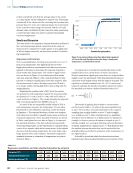
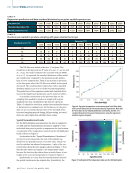
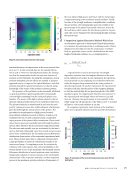
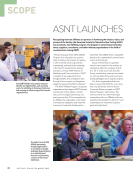
sample volume. While wave speed is generally inversely pro- portional to porosity (Slotwinski et al. 2014 Qu and Cherkaoui 2006), the wave speed maps do not show a clear correlation to porosity, with the exception of the large pore network near the center of the sample. The lack of correlation is likely due to factors other than porosity impacting the wave speed, such as anisotropy resulting from a finite number of grains through the sample thickness. Optical microscopy identified grains to be on average 210 ± 110 μm in diameter, meaning that for our sample thickness, it is estimated that around 14 grains are present in the propagation path of the ultrasonic beam. Thus, assumptions of statistical isotropy would fail and result in variations in the mean elastic constants across the sample, which correspond to fluctu- ations in wave speed (Johnson 1986). In fact, for an SS316L single crystal (c11 = 206 GPa, c12 = 133 GPa, c44 = 119 GPa), the maximum and minimum wave speeds are 6284 and 5074 m/s, respectively (Ledbetter 1983 Kupperman and Reimann 1978). The wave speeds observed in this sample are effectively bounded by these two estimates with the exception of a few points on the top edge which diverge due to waveform distortion. Therefore, it is likely that the correlation of wave speed to porosity is being inhibited by the stronger effects of anisotropy. The XCT pore reconstruction for SS316 + bronze (Figure 4a) shows a porosity gradient, with higher porosity on the right, as well as smaller, more evenly distributed pores than in the SS316L. The porosity gradient is likely due to insufficient bronze infiltration, as the infiltration direction is from left to right. Accordingly, UT results show a gradient from left to right in Figure 5. Representative optical micrographs: (a) left end of the gauge region for the SS316L sample (b) right end of the gauge region for SS316L sample (c) left end of the gauge region for the SS316 + bronze sample (d) right end of the gauge region for the SS316 + bronze sample. In 5c and 5d, the yellow regions are bronze, blue regions are SS316, and black regions are pores. 500 μm 500 μm 500 μm 500 μm 10 × 105 μm3 14 × 105 μm3 350 Np/m 250 Np/m 150 Np/m 5325 m/s 5275 m/s 5250 m/s 5300 m/s 6 × 105 μm3 2 × 105 μm3 5 mm Figure 4. SS316 + bronze sample: (a) XCT pore reconstruction (b) attenuation (c) wave speed. ME | BINDERJETAM 42 M A T E R I A L S E V A L U A T I O N • A P R I L 2 0 2 2

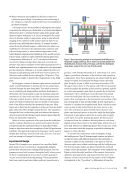
maps of increasing attenuation and decreasing wave speed, con- sistent with porosity increases. In this sample, it is more difficult to identify the shapes of pores through ultrasound however, it is important to note that the changes seen in the ultrasonic parameters denote sensitivity to the small pore volumes and ability to detect an increase in the concentration of pores over a large area. These relative changes in wave speed and attenua- tion could be used as feedback for optimizing printing parame- ters, such as bronze infiltration amounts, to reduce porosity. We hypothesize that other changes in the wave speed that cannot be directly linked to porosity variations are due to varying volume fractions of bronze and SS316 across the sample area. These results indicate that depending on material, ultra- sound metrics of wave speed and attenuation could prove to be valuable tools in assessing porosity. When porosity dominates the response, ultrasonic properties provide much of the same information about relative porosity as XCT. In addition, ultra- sonic data can provide insight into other microstructural features such as grain size and volume fraction of various phases. Conclusions and Future Work This study demonstrates a robust technique for identifying the porosity characteristics of binder-jetted samples using ultra- sound. The approach used simultaneously measures wave speed and attenuation to interrogate samples with distributed porosity and pore networks. Most notably, the technique accom- plishes a thickness-independent measurement for wave speed, calculates the thickness at each scanning position, and then uses this thickness to obtain more accurate measurements of absolute attenuation. When examining maps of porosity based on XCT versus maps of wave speed and attenuation, the follow- ing conclusions were drawn. In SS316L, there were large pore networks of nonuniform size distributed throughout the sample. The attenuation map identified the larger networks but was less sensitive to small variations in the relative porosity of other parts of the sample. The wave speed map showed a decrease in wave speed in the area of the largest pore network, but in other areas wave speed variations did not match well with the presence of pores. The discrepancy in wave speed correlations with porosity was attributed to large grains in SS316L likely inducing anisot- ropy. In SS316 + bronze, pores were smaller and more uniformly shaped than in SS316L, and the concentration and size of these pores increased from left to right. Wave speed and attenuation maps show a response dominated by porosity, with wave speed decreasing and attenuation increasing with increased porosity. These results underscore the applicability of UT as a character- ization method for additively manufactured samples. With this proof-of-concept, researchers can actively pursue the investiga- tion of binder jet parts using UT, allowing valuable information about the relationship between processing and microstructure to be extracted. As a result, binder jet printing can be advanced with this knowledge by enabling selection of optimal processing parameters to produce parts with desirable and consistent prop- erties and performance. ACKNOWLEDGMENTS The authors are grateful for the financial support by M Co. (Grant Number ). Any opinions, findings, and conclusions, or recommen- dations expressed in this material are those of the authors and do not necessarily reflect the views of M Co. The block samples were provided to M Co. by ExOne. REFERENCES Bradley, D., and G. Roth, , “Adaptive Thresholding Using the Integral Image,” Journal of Graphics Tools, Vol. , pp. –, https://doi.org/. /X.. Costa-Júnior, J.F.S., G.A. Cortela, L.E. Maggi, T.F.D. Rocha, W.C.A. Pereira, R.P.B. Costa-Felix, and A.V. Alvarenga, , “Measuring Uncertainty of Ultrasonic Longitudinal Phase Velocity Estimation Using Different Time- Delay Estimation Methods based on Cross-Correlation: Computational Simulation and Experiments,” Measurement, Vol. , pp. –, https:// doi.org/./j.measurement... Daniel, I.M., S.C. Wooh, and I. Komsky, , “Quantitative Porosity Char- acterization of Composite Materials by Means of Ultrasonic Attenuation Measurements,” Journal of Nondestructive Evaluation, Vol. , pp. –, https://doi.org/./BF Do, T., T.J. Bauder, H. Suen, K. Rego, J. Yeom, and P. Kwon, , “Addi- tively Manufactured Full-Density Stainless Steel L with Binder Jet Printing,” Proceedings of the ASME th International Manufacturing Science and Engineering Conference, Vol. : Additive Manufacturing Bio and Sustainable Manufacturing, https://doi.org/./MSEC- du Plessis, A., I. Yadroitsev, I. Yadroitsava, and S.G. Le Roux, , “X-Ray Microcomputed Tomography in Additive Manufacturing: A Review of the Current Technology and Applications,” D Printing and Additive Manufac- turing, Vol. , No. , pp. –, http://doi.org/./dp.. Fei, D., D.K. Hsu, and M. Warchol, , “Simultaneous Velocity, Thick- ness and Profile Imaging by Ultrasonic Scan,” Journal of Nondestructive Evaluation, Vol. , pp. –, https://doi.org/./A: Foster, D.R., M.J. Dapino, and S.S. Babu, , “Elastic Constants of Ultrasonic Additive Manufactured Al -H,” Ultrasonics, Vol. , pp. –, https://doi.org/./j.ultras... German, R.M., , Sintering Theory and Practice, John Wiley & Sons Inc. Gong, H., C. Crater, A. Ordonez, C. Ward, M. Waller, and C. Ginn, , “Material Properties and Shrinkage of D Printing Parts Using Ultrafuse Stainless Steel LX Filament,” MATEC Web Conference, Vol. , https:// doi.org/./matecconf/ Hassen, A.A., and M.M. Kirka, , “Additive Manufacturing: The Rise of a Technology and the Need for Quality Control and Inspection Tech- niques,” Materials Evaluation, Vol. , pp. – Honarvar, F., and A. Varvani-Farahani, , “A Review of Ultrasonic Testing Applications in Additive Manufacturing: Defect Evaluation, Material Characterization, and Process Control,” Ultrasonics, Vol. , https://doi.org/./j.ultras.. Huang, N., O.J. Cook, R.L.W. Smithson, C.M. Kube, A.P. Argüelles, and A.M. Beese, , “Use of Ultrasound to Identify Microstructure-Property Relationships in Stainless Steel Fabricated with Binder Jet Additive Manufacturing,” Additive Manufacturing, Vol. , https://doi.org/./j .addma.. Ilogebe, A.B., B. Uzochukwu, and A.M. Elliot, , “Porosity Determi- nation and Characterization of Binder Jet Printed Structural Amorphous Metal (SAM) Alloy Parts Using X-Ray CT,” Nanotechnology & Applications, Vol. , No. , https://doi.org/./-. Johnson, G.C., , “Variations in the Second- and Third-Order Elastic Constants in Polycrystalline Aggregates,” Journal of Applied Physics, Vol. , pp. –, https://doi.org/./. Koester, L.W., H. Taheri, T.A. Bigelow, P.C. Collins, and L.J. Bond, , “Nondestructive Testing for Metal Parts Fabricated Using Powder-Based Additive Manufacturing,” Materials Evaluation, Vol. , pp. – A P R I L 2 0 2 2 • M A T E R I A L S E V A L U A T I O N 43
ASNT grants non-exclusive, non-transferable license of this material to  .
All rights reserved. © ASNT 2026. To report unauthorized use, contact: customersupport@asnt.org