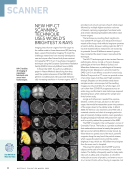
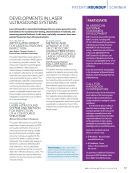
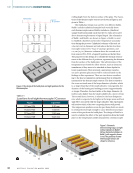
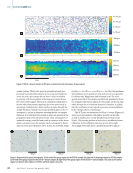
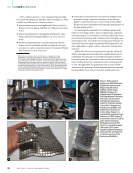
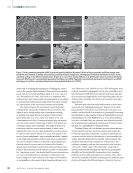
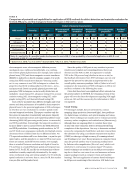
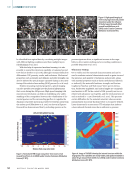
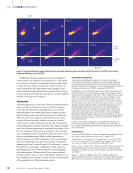
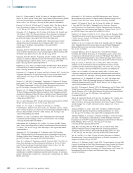
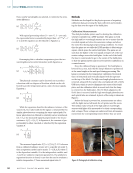
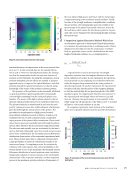
other work is studying the importance of Marangoni convec- tion on the capture and retention of these particles in molten pools with an extended tail (Hojjatzadeh et al. 2019 Gan et al. 2017 Khairallah et al. 2016). Such work is in alignment with evidence that raster scan powder bed strategies are more likely to contain these spherical pores that arise from alloy constitu- ent vaporization, while spot-scan strategies are less likely. LOF defects (Figure 2b) are features caused by partial melting of the material by insufficient heat and can be clas- sified by poor overlap within layers, inadequate wetting, or shallow melt pools that do not interact with previous layers (Polonsky et al. 2020 Calta 2019 Martin et al. 2019 Cunningham et al. 2019). Scanning strategies play an import- ant role in the creation of this type of defect. LOF defects are common in linear raster strategies, especially in those loca- tions when the heat source reduces speed to make turns, making the zones near the edges particularly common places to observe these defects (Zhou et al. 2015). This points to the need to better understand—and potentially measure—signals of the depth of penetration of the molten pool, as opposed to the current method, which is commonly a preprogrammed function related to power and acceleration/deceleration speeds. Such information would better represent the process physics. The formation of LOF defects can also be responsible for “turbulence events” that hinder fluid flow and can promote even more heterogeneities in chemistry. Furthermore, the local cooling rates can be related to the shape of LOF defects or be identified as the cause of their formation (Kenney et al. 2021 Bayat et al. 2019 Wolff et al. 2017). NDE techniques, such as X-ray computed tomography, can be very powerful tools to first determine if LOF defects are present in the part and also their location and approximate sizes, depending upon the res- olution of the technique, the depth of penetration, and other shape factors. Excessive heat can form other defects such as those asso- ciated with the “balling phenomenon” (Figure 2c) in which liquid droplets of metal are ejected from the melt pool, cool rapidly, and then land on the melt pool (potentially becoming incorporated) or other regions of the part (Khairallah et al. 2016 Gunenthiram et al. 2018 Haghdadi et al. 2021). These droplets, once they cool and if they are captured, may effectively modify the local properties (topological, mechanical, chemical, texture, thermal, etc.) and influence subsequent layers. Cracking (Figure 2d) is a dynamic process where the rates of heat transfer and the concurrent stresses and strains due to thermal expansion/contraction, or phase transformations, compete with the ability of the material to accommodate the strains, typically defined by the ductility of the material. The problems associated with cracking are well known in the welding community and are often associated with concepts such as the “brittle range” (the temperature range that a material will still have strength but without any measurable ductility) and the nil ductility temperature. Such cracking problems exist for AM materials for two reasons. First, AM is effectively a spatially controlled welding process, with the same physics, although with different degrees of severity. Second, ME | AMNDEOVERVIEW 20 μm Welding direction 150 μm 300 μm 100 μm 20 μm 20 μm Melt flow Figure 2. Defects commonly observed in AM: (a) spherical porosity (indicated by arrows) (b) lack of fusion caused by insufficient energy input to melt the stock material (c) balling (d) hot tearing caused by excessive energy input, creating ejecta of material and thermal stresses and (e) and (f) fish scaling, at two different magnifications. (Figure 2a is reused from Tammas-Williams et al. [2015] under Creative Commons Attribution License (CC BY) Figure 2c is reprinted with permission from Zhou et al. [2015] Figure 2d is reprinted with permission from Pogson et al. [2004] and Figures 2e and 2f are reprinted with permission from Sochalski-Kolbus et al. [2015]). 50 M A T E R I A L S E V A L U A T I O N • A P R I L 2 0 2 2

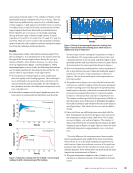
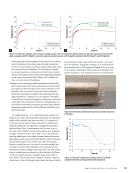
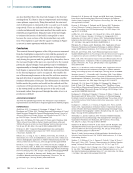
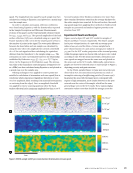
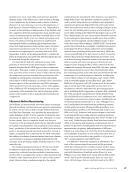
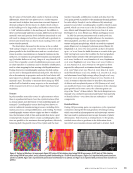
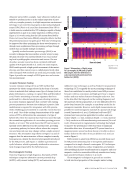
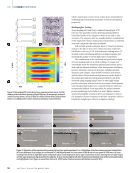
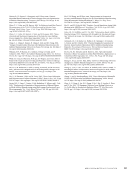
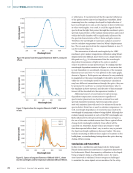
the 3D nature of the builds often results in thermal cooling differentials, where the base plates are at a colder tempera- ture and result in higher heat extraction rates and degrees of thermal cycling for the first layers of a build, which reduces as the builds get to be larger/taller, and further removed from a “cold” substrate relative to the molten pool. In addition to these conventionally understood cracks, differences in the local material’s state and porosity levels (whether intentional or not) will result in changes in heat flow and will lead to gradients in stresses and strains that can lead to local cracking, even in oth- erwise ductile material. The final defect discussed in this review is the so-called “fish scaling” (Figures 2e and 2f). This defect is observed in the planes parallel to the build direction and are a result of vari- ations in solute concentrations or chemical variations in the melt pool, or variations in precipitate formation and morphol- ogy (Sochalski-Kolbus et al. 2015 Tang et al. 2015 Brandl et al. 2012). This is typically a result of solidification processes, such as solute rejection in columnar and/or dendritic solidification, and/or solute trapping for fast-moving solid-liquid interfaces. During destructive metallographic analysis, this fish scaling can be used to distinguish individual melt pools. This defect is also a discontinuity in properties such as the local elastic stiff- ness tensor (Cij), density, composition, and other aspects of the material’s state. The ability to measure these using any NDE method will be limited in many respects, as the wavelength of the measurement devices is much larger than these local variations. Texture In polycrystalline materials, texture is a phenomenon where there is a preferential bias in how the crystal structures (that is, atomic planes and directions) of each individual grain are arranged. Crystallographic texture has long been known to exist in traditional manufacturing processes, including defor- mation processes, casting/solidification, and welding. For those crystallographic textures whose origins are due to solidifica- tion, the literature is full of data and models that show a pref- erential growth of grains where certain crystallographic direc- tions are parallel to the maximum thermal gradients, effectively balancing both the growth rates of the crystals and the heat transfer. Classically, solidification models and data show the [001] grain growth is parallel to the maximum thermal gradient for cubic alloys, though it can be influenced by anisotropy parameters and other crystallographic variables related to grain growth, which can even occur in the [110] direction (Chalmers 1964 Morris and Winegard 1969 Ferry 2006 Liu et al. 2013 Boettinger et al. 2000 Henry 1943 Henry and Rappaz 2000). In AM, the process parameters such as melt-pool size, scanning strategy, and layer height influence the maximum thermal gradient, and thus are mainly responsible for texture and grain morphology, which can result in equiaxed grains (Figure 3a) or elongated columnar grains (Figure 3b) (Haghdadi et al. 2021). The [001] growth can have deviations up to ~10° to 20° from the build direction as a result of the spa- tially varying heat source that modifies the thermal gradient, and this texture persists with subsequent layers (Quintana et al. 2020 Saville et al. 2021 Kamath et al. 2021 Stephenson et al. 2020 Haghdadi et al. 2020 Shao et al. 2020 DeMott et al. 2021 Kumar et al. 2021). Texture in AM parts has been reported for alloys such as titanium-based (Bermingham et al. 2015 Vilaro et al. 2011 Wu et al. 2002 Qiu et al. 2015), nickel-based (Kunze et al. 2015 Dinda et al. 2012 Bi et al. 2014), and aluminum-based high-entropy alloys (Joseph et al. 2015 Sun et al. 2014), among others (Song et al. 2014 Zecevic et al. 2015). As texture is directly related to heat flow, the presence of defects such as spherical pores or LOF (Kenney et al. 2021) can modify the heat vector and the orientation of the columnar grain growth and in some cases, the columnar grains can stop at the “floors” of these defects. This local disruption is an example of a correlated microstructural feature that may help to identify defects—even those that are subsurface—in AM components. Residual Stress During AM processing, parts can experience cyclic expansion/ contraction during the thermal gyrations of heating/cooling, which can result in inhomogeneous and anisotropic stresses that can result in permanent microscopic domains of plastic deformation. This is known as residual stress. To be specific, residual stress refers to gradients in the dislocation densi- ties (which accommodate stresses and lead to strains). Such 300 μm 300 μm 111 001 101 2 cm Figure 3. Texture in AM alloys: (a) inverse pole figure (IPF) plots of 316L stainless steel using 150 W laser power (b) IPF plots of 316L stainless steel using 1000 W laser power and (c) columnar growth and banding in a Ti-6Al-4V tensile coupon. (Figure 3a is reprinted with permission from Laleh et al. [2019] Figure 3b is reprinted with permission from Niendorf et al. [2013] and Figure 3c is reprinted with permission from Carroll et al. [2015].) A P R I L 2 0 2 2 • M A T E R I A L S E V A L U A T I O N 51 Building direction Building direction
ASNT grants non-exclusive, non-transferable license of this material to  .
All rights reserved. © ASNT 2026. To report unauthorized use, contact: customersupport@asnt.org