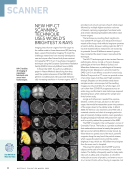
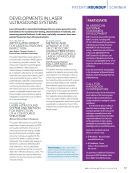
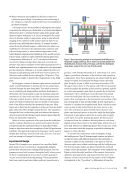
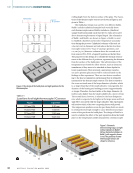
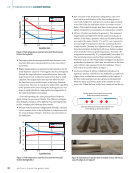
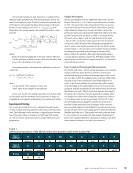
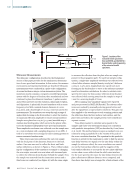
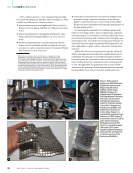
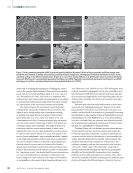
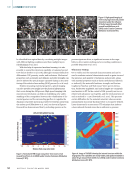
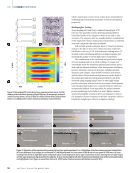
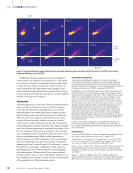
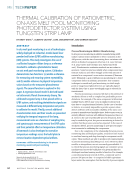
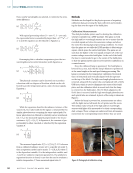
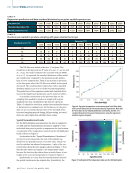
which, based upon current work, makes them unsuitable for evaluating microstructural anomalies as well as mechanical properties. Radiographic Testing X-ray imaging (2D) and X-ray computed tomography (CT) (3D) are very powerful tools for detecting internal defects embedded inside of the sample for both in situ and ex situ scenarios. The output results are usually intuitive visualizations of the inspected volume, making data interpretation a relatively easy task compared with other modalities. With its high spatial resolution, micro CT has been demon- strated to be able to detect low volume fractions of porosity (du Plessis et al. 2015), LOF, and inclusions, making micro CT an ideal tool for developing AM process improvements and ensuring the quality of certain high-value components. The combination of the resolution and penetration depth of X-ray imaging makes it an ideal technique to image and scientifically study the subsurface physical phenomena associ- ated with the dynamic behavior of the laser powder bed fusion process. Subsurface melt-pool dynamics, including keyhole dynamics and collapse, vapor bubble formation and motion, and the effect of laser turnaround parameters on the depth of the molten pool and associated generated defects can all be observed using imaging using X-rays (or other high-energy particle techniques, such as neutron or protons), which permits some fundamental studies to be conducted that are otherwise exceptionally difficult, if not impossible, for surface-sensitive process monitoring tools (Calta et al. 2019). Figure 9 demon- strates the possibility of using in situ X-ray imaging to observe the dynamics of pore formation at the laser turnpoint, which is helpful for designing an effective mitigation strategy. x (mm) V (V) –5.5 –5 0 1 2 3 4 9 8 7 6 5 4 3 2 1 0 –4.8 –4.9 –5 –5.1 –5.2 –5.3 –5.4 –5.5 Figure 8. Heterodyne ECT system based on a magnetoresistive sensor: (a) CAD drawing of desired defect geometry (depth 200 μm) (b) microscopic picture of artificial surface defects and (c) ET data of artificial surface defects (reused from Ehlers et al. [2020] under Creative Commons Attribution License [CC BY]). 500 μm Voids Turn point Turn point Track Surface depression Powder Side-on Top-down Figure 9. Illustration of the experimental geometry for laser turn point experiments: (a–c) illustration of the laser turnaround point studied here (d–f) time difference X-ray images of a turnaround in Ti-6Al-4V performed at a laser power of 200 W and set scan speed of 1000 mm/s (d) laser scanning from the left to right with spatter and powder above a melt depression due to vapor recoil below (e) laser entering the turn point region and the vapor depression digs deep into the substrate (f) laser moving right to left after the turnaround. Keyhole voids at the turnaround location are highlighted in red. (Figure is reused from Calta et al. [2019] under Creative Commons Attribution License [CC BY].) ME | AMNDEOVERVIEW 56 M A T E R I A L S E V A L U A T I O N • A P R I L 2 0 2 2 y (mm) 2 mm 2 mm 2 mm 2 mm 200 μm 150 μm 100 μm 50 μm V (V)

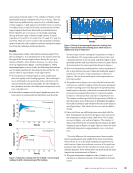
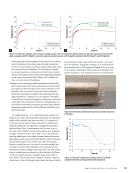
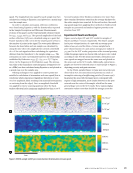
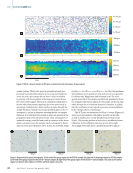
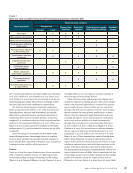
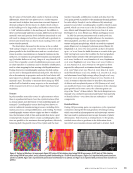
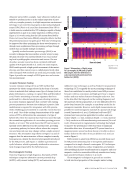
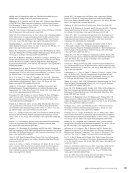
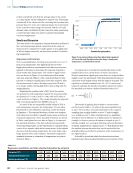
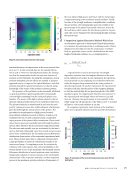
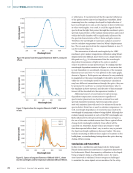
Similar work has been done by Hojjatzadeh et al. (2019), where direct observation and quantification of melt-pool vari- ation during the laser powder bed fusion AM process under constant input energy density is done by in situ high-speed, high-energy X-ray imaging. The results, shown in Figure 10, are important for understanding the laser powder bed fusion AM process and guiding the development of better metrics for pro- cessing parameter design. Thermal/Infrared Testing (IR) IR is an imaging technique that uses the thermal radiation of an object to determine its characteristics (Ida and Meyendorf 2019). Compared with other NDE methods such as UT and RT, IR is fast and can be used to inspect large areas simul- taneously (in other words, scanning is not required). The measured surface radiation can reveal the existence of dis- continuities that affect heat conduction in metal AM parts since surface temperature and its distribution depend on the thermal diffusion of the material as well as the geometry and location of the discontinuities (Mandache 2019). Analyzing layer-by-layer thermal images in terms of the spatial and temporal variations of thermal signatures (for example, peak intensity, decay, and number of gyrations) can be used as a surrogate for defect formation tendency during laser powder bed fusion processing (McNeil et al. 2020). Further, Figure 11 demonstrated that the in situ conclusions can be cross- verified by ex situ X-ray CT (XCT) measurement results (McNeil et al. 2020). Pore Pore Scan direction Scan direction Circulation Transition Laser interaction Figure 10. Single-pulse X-ray images showing pore motion within melt pools: (a–d) pore dynamics during the laser powder bed fusion process and (e–h) pore dynamics during melting of a bare substrate. Pores follow circular patterns during circulation (10a and 10e) they present irregular movement during transition (toward the surface and escaping) (10c and 10g) or circulating in the melt pool (10b and 10f). They move toward the depression zone and escape the melt pool during the laser interaction (10d and 10h). The dotted arrows (10b, 10c, 10d, 10g, and 10h) show the future trajectories of the pores, while the solid arrows (10a, 10e, and 10f) indicate the history of the trajectories. The dashed line indicates the boundaries of the melt pool and the depression zone in 10d and 10h. (Figure reused from Hojjatzadeh et al. [2019] under Creative Commons Attribution License [CC BY].) 16 000 14 000 12 000 10 000 8000 6000 10 12 14 16 18 20 22 24 2 4 6 8 10 12 14 16×10–3 16×10–3 12 8 4 8 12 16 20 Width (mm) Width (mm) 15 mm Figure 11. X-ray computed tomography (XCT) is used as an ex situ characterization technique to provide the cross comparison with data acquired by in situ techniques such as thermal/infrared testing (IR) and optical imaging: (a) ex situ XCT data for layer 309 (b) in situ optical images from the same location showing contrast, which is related to surface irregularities (c–f) in situ IR frames from the same layer within the defect location shown in Figure 11a, captured when the laser completes the raster. (Figure reprinted with permission from McNeil et al. [2020].) A P R I L 2 0 2 2 • M A T E R I A L S E V A L U A T I O N 57 Intensity (counts) Length (mm) Length (mm)
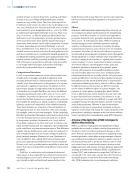
ASNT grants non-exclusive, non-transferable license of this material to  .
All rights reserved. © ASNT 2026. To report unauthorized use, contact: customersupport@asnt.org