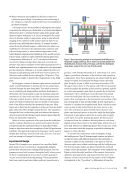
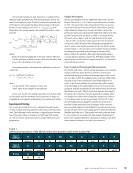
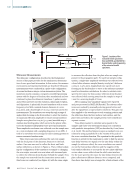
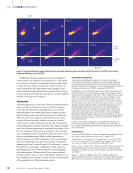
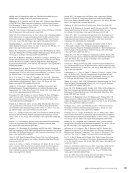
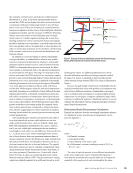
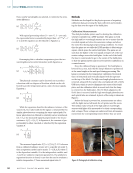
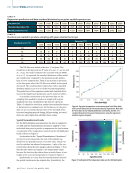
(du Plessis et al. 2018). Trade-offs between resolution, the size of the region of interest, and the time and cost associated with XCT scanning may preclude this technique from widespread implementation for quality control. Ultrasonic testing (UT) has the potential to be used as a porosity detection tool, much like XCT, due to its sensitivity to the elastic properties of the medium through which ultrasonic waves propagate. Compared to XCT, UT is an economical alternative for characterizing the microstructure of binder- jetted parts, enabling inspection of larger part volumes without increased costs. UT has been demonstrated to have measur- able sensitivity to porosity through multiple metrics including wave speed and attenuation (Slotwinski et al. 2014 Daniel et al. 1992). In previous studies, UT has been employed to character- ize the properties of AM parts (Mandache 2019 Honarvar and Varvani-Farahani 2020 Koester et al. 2018). Lopez et al. (2018) studied different nondestructive methods for monitoring wire and arc AM parts and found that UT was a suitable method for both in situ and ex situ defect detection and sizing. Slotwinski et al. (2014) used UT as a method for assessing porosity in CoCr samples made by selective laser melting and found that wave speed correlates well to porosity identified by XCT mea- surement. Ultrasound has also been used to assess the elastic constants of parts made by ultrasonic additive manufacturing (UAM), where UAM-produced parts were found to have up to a 48 reduction in elastic constant values compared to a con- ventionally manufactured sample (Foster et al. 2013). Sotelo et al. (2021) employed immersion ultrasound to measure wave speed and attenuation and characterize the spatially varying properties of hybrid AM samples. With the exception of the authors’ recent paper investigating binder jet printed parts using UT, these methods have not been explored to character- ize binder-jetted components (Huang et al. 2022). In this paper, UT is used to investigate the microstructure and porosity of binder jet AM parts made of stainless steel 316L and stainless steel 316 infiltrated with bronze. Samples are tested in an immersion system in a pulse-echo, normal-incidence con- figuration. Validated ultrasonic methods are merged to generate spatial maps of longitudinal attenuation and wave speed in samples with spatially varying porosity. Ultrasonic maps are then compared to XCT measures of porosity. The results illus- trate the effectiveness of UT in identifying large pore networks in the stainless steel as well as the presence of distributed porosity in the stainless steel infiltrated with bronze. Background While ultrasonic wave speed measurements usually rely on precise knowledge of the sample thickness, Kuo et al. (1990) reported an alternative method that eliminates the need for a priori thickness measurements, and Fei et al. (2001) expanded this method to conduct simultaneous measurement of wave speed and thickness. Figure 1 depicts the test configu- ration, which requires that the sample be tested in pulse-echo mode with a planar reflector directly behind the sample. As shown in Figure 1, two consecutive measurements with and without the sample present are necessary to calculate the time of arrival of the sample front-surface reflection (T1), the sample back-surface reflection (T2), the plate reflection with the sample in the propagation path (TM), and the plate reflection without the sample in the propagation path (TW). From the time of arrival of these reflections, the longitudi- nal wave speed in the sample can be calculated by: (1) c L = W TM) T2 T1) ( +1&c !(T " % # $ water where cwater is the wave speed in the water. The sample thickness (tsample) can then be estimated by: (2) tsample = cL T2 T1) ( 2 which can be used to calculate attenuation. Absolute atten- uation measurements also require consideration of system effects. Various approaches have been proposed, such as those in Lerch et al. (2006), but the equal diffraction method described in Yu et al. (2001) was employed herein. In Yu et al.’s method, a reference sample with near-zero attenuation is measured with identical system settings (such as gain, fre- quency filters, and input voltage) to the test samples. The water paths (WP), or the distance that the wave propagates through water before entering the solid, for the sample and reference, are set to satisfy the equivalent path relation: (3) WP Ref +t Ref cRef c water = WP sample +t sample c sample c water where c is the wave speed, and t is the thickness for the reference (“Ref”) or sample. Reflector Sample Transducer T 1 T 2 T M Reflector Sample Transducer T W Figure 1. Schematic of the experimental configuration for thickness- independent wave speed measurements: (a) the reflections collected when the sample is present (b) the reflection collected after the sample is removed. ME | BINDERJETAM 38 M A T E R I A L S E V A L U A T I O N • A P R I L 2 0 2 2

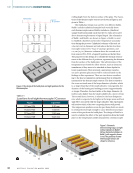
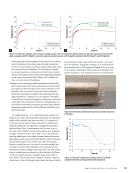
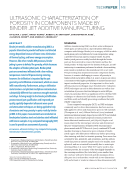
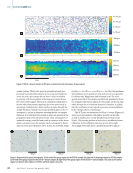
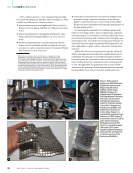
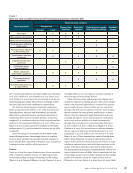
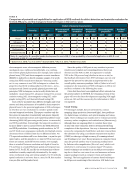
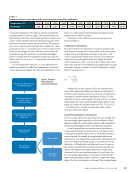
For focused transducers, this expression is satisfied when using the same transducer for both measurements (that is, the same focal length in water, F) and by setting the material path (MP) equal to the sample thickness (by focusing on the back surface of each sample) since WP = F – (csample/cwater)MP. From these two measurements, the attenuation can be calcu- lated by: (4) " sample f ( ) = 1 2t sample ln’ ! sample f # % R2 Ref # $1 % &RRef ( ) ! Ref f # % 1 R2 sample # $ % & Rsample ( )( # $ ’ ’ % & ( ( +" water f ( ) WP Ref WP sample ( ) t sample where |Γ(f)| is the spectral amplitude of the back surface reflection, R is the reflection coefficient at the solid-water interface, and αwater is the attenuation in the water. At normal incidence, the reflection coefficients can be cal- culated by: (5) R = csolid!solid cwater!water csolid!solid + cwater!water where ρ is the density of the sample or water, and “solid” refers to the sample or the reference. In the next section, the sample materials used in this study are described, and the methods used to generate 2D maps of longitudinal wave speed and attenuation are explained in detail. Experimental Testing The results presented herein were obtained through careful control of experimental parameters and post processing of the data. The following section includes a comprehensive descrip- tion of the steps taken to produce both UT and XCT results, as well as relevant information about sample fabrication and preparation. Sample Description SS316L and stainless steel 316 infiltrated with bronze (SS316 + bronze) blocks (25 × 25 × 50 mm3) were fabricated via binder jet AM . SS316L powder with 90 particles below 22 μm size was used to fabricate the SS316L block, while SS316L powder with a diameter range of 20–53 μm was used to create the green part which was subsequently infiltrated with bronze. The powder compositions are given in Table 1. The bulk density of SS316L is 8000 kg/m3, and the bulk density of the SS316 + bronze with 40 bronze is 8304 kg/m3 by rule of mixtures (Gong et al. 2018). Electrical wire discharge machining was used to extract one tensile specimen from each block, as indi- cated in Figure 2. The specimens were polished using standard metallographic grinding and polishing techniques with silicon-carbon SiC abrasive disks and a final polish using a 0.05 μm alumina gamma suspension. Polished samples were ultrasonically tested and then imaged using XCT as described in the following sections. X-ray Computed Tomography Measurements The SS316L and SS316 + bronze tensile specimens were scanned using a multi-scale nano/microCT system to observe pore morphology along the entirety of the gauge region with a voxel size of 10 μm. In XCT, the sample rotates on its axis while being exposed to the source-generated X-rays (Wilson-Heid et al. 2019). As the X-rays irradiate the material, they will be attenu- ated depending on the spatial differences in electronic density and mass, with the transmitted X-rays detected by a 2D detector (du Plessis et al. 2018). The 2D projection data are then used to reconstruct the volumetric data for quantitative analysis. Here, 900 images were taken while rotating the sample 360° with an X-ray exposure time of 500 ms per image. The raw XCT data sets were imported into ImageJ to convert the 32-bit recon- structed volume projection into 2D images, which were pre- processed and adaptively thresholded for porosity based on the average intensity of the surrounding pixels in MATLAB (R2021a) (Bradley and Roth 2007). The images were then read into Avizo (v. 2020.2) for pore reconstruction and analysis. Indications of pores were uniquely labeled for quantitative analysis, and those with volumes less than 27 000 μm3 were removed. T A B L E 1 Chemical compositions of the SS316L and bronze powders used in this study (wt%) Type 1 (SS316L) Fe Cr Ni Mo Mn Si C O N Balance 17 12 2.5 1.5 0.8 0.01 0.06 0.1 Type 2 (SS316L) Fe Cr Ni Mo Mn Si C P S Balance 16–18 10–14 2–3 ≤2 ≤1 ≤0.03 ≤0.045 ≤0.03 Bronze Cu Sn 90 10 A P R I L 2 0 2 2 • M A T E R I A L S E V A L U A T I O N 39
ASNT grants non-exclusive, non-transferable license of this material to  .
All rights reserved. © ASNT 2026. To report unauthorized use, contact: customersupport@asnt.org