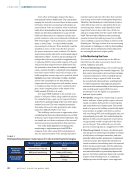
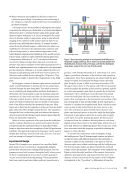
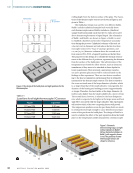
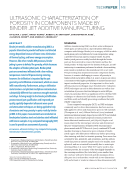
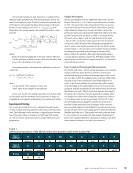
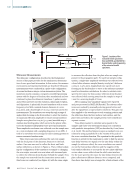
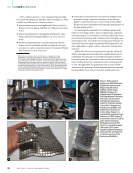
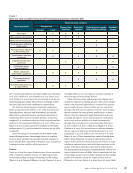
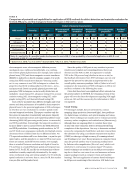
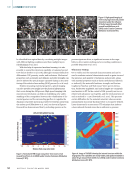
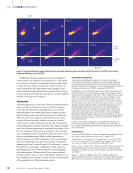
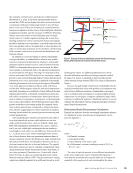
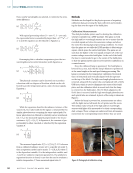
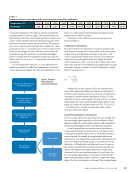
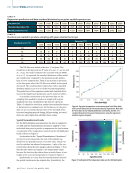
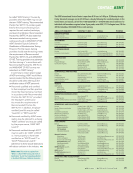
Ultrasonic Measurements The ultrasonic configuration described in the Background section of this paper provides for the simultaneous determina- tion of wave speed and attenuation. In this section, the measure- ment system and experimental details are described. Ultrasonic measurements were conducted in a pulse-echo configuration at normal incidence using a custom immersion system. The immersion system contains a computer-controlled positioning system with five degrees of freedom, three translational and two rotational, to place the ultrasonic transducer. A pulser-receiver and a DAQ card were used for excitation, ultrasound reception, and digitization. A spherically focused transducer with a center frequency of 25 MHz, nominal element diameter of 0.25 in. (6.35 mm), and a focal length of 1 in. (25.4 mm) was used in the measurements. The transducer was swept through a range of angles while focusing on the front surface to select the location of maximum reflection amplitude to ensure normal incidence. Samples were placed on 0.125 in. (3.175 mm) standoffs atop a stainless steel leveling plate, which served as the planar reflec- tor for the thickness-independent wave speed measurements. Time-amplitude waveforms were collected over the sample area at 0.1 mm resolution with a sampling frequency of 500 MHz. A total of 15 waveforms were averaged at each scanning position to remove unwanted random noise. Three total scans were performed for each test sample with the focal point of the ultrasonic beam set to the back surface. One scan was used to collect the front- and back- surface reflections, as shown in Figure 1a. Then, without adjust- ing the configuration of the transducer or sample or changing the scan origin, a second scan was taken with increased gain to collect the reflection from the plate behind the sample. Next, the sample was removed from the immersion system and a third scan was conducted (see Figure 1b) with the same origin to measure the reflection from the plate when no sample was present in the propagation path. For each test sample config- uration, a single time-amplitude waveform was collected over a fused silica reference sample (density 2214 kg/m3, thickness 0.0625 in. [1.5875 mm], longitudinal wave speed 6026 m/s) focusing on the back surface to serve as the reference measure- ment for attenuation calculations. In order to calculate wave speed in the water, the front-surface reflection from the plate was collected while moving away from the sample in steps of 1 mm for a scanning length of 8 mm. After scanning, time-amplitude signals were exported and post-processed in MATLAB (R2018b). The relevant reflec- tions were isolated by manually selecting points before and after the signal from a representative waveform. This gate was then applied to the waveforms at each scanning position and the reflections from the front surface, back surface, and the plate with and without the sample present were isolated into separate vectors. Time delays needed to calculate wave speeds in the samples and water were determined using cross correlation with parabolic interpolation (CPI) as described by Costa-Junior et al. (2018). This method improves upon a standard cross cor- relation by using a parabolic fit in the vicinity of the peak of the cross-correlation function. The equation for this parabolic function is solved for the maximum in order to find the precise time delay between two signals. For the time delay within the sample (or reference silica), the cross correlation was carried out on the front-surface reflection and the negative of the back-surface reflection to account for the 180° phase shift that occurs when a wave reflects from the solid-water interface. For the wave speed in the water, the time delays between the plate reflections at different distances were computed, and then these time delays were averaged for a final estimate of the 16.43 mm 1.5 mm 10 mm 10 mm Sample R3.94 3.94 mm 46 mm 11.85 mm 6.57 mm Sample Figure 2. Locations of the extracted tensile specimens from (a) SS316L and (b) SS316 + bronze blocks and (c) geometry of the extracted tensile specimens. ME | BINDERJETAM 40 M A T E R I A L S E V A L U A T I O N • A P R I L 2 0 2 2 Vertical build direction

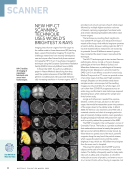
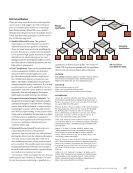
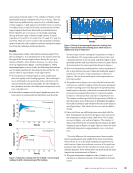
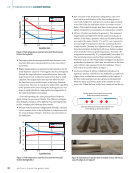
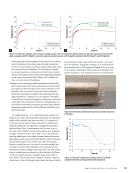
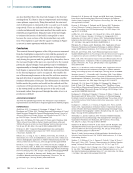
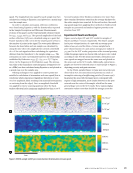
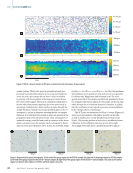
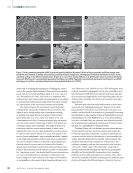
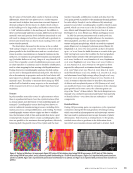
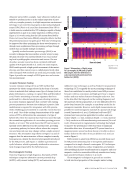
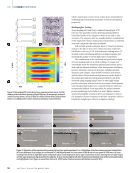
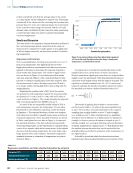
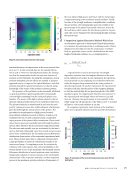
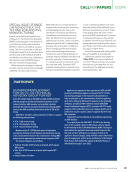
speed. The longitudinal wave speed for each sample was then calculated according to Equation 1 and plotted as a spatial map over the sample area. In order to calculate attenuation, reflection coefficients were found using Equation 5 with the density values reported in the Sample Description and Ultrasonic Measurements sections of this paper and the experimentally obtained values for csilica, csample, and cwater. The spectral amplitudes of the back surface reflection, |Γ(f)|, were calculated using an n-point fast Fourier transform with n set to be the nearest power of two to the number of points in the signal. The water path difference between the fused silica and test sample was calculated by using the time where the amplitude first crossed a threshold of 0.1 V for each signal and then calculating the equivalent distance from the transducer to the sample using cwater.. The attenuation in water was estimated based on the relationship established by Pinkerton: αwater (f) = (25.3 × 10⁻¹⁵)f 2 Np/m, where f is the frequency in Hz (Pinkerton 1949). The attenua- tion value at the transducer center frequency (estimated to be 22.4 MHz) was then calculated using Equation 4 and plotted as a spatial map over the sample area. Filtering techniques were applied to remove points not suitable for calculation of attenuation and wave speed (that is, waveforms which experienced significant distortion or were very low amplitude, likely resulting from material heterogeneity or scattering from the edges). First, an amplitude threshold was applied to remove scanning positions where the back- surface reflection had a maximum amplitude less than 0.008 V. Second, locations where thickness estimates were more than three standard deviations away from the average thickness for the entire sample were removed. In the next section, the result- ing spatial maps from applying these methods to binder-jetted samples are presented and analyzed against porosity recon- struction from XCT. Experimental Results and Analysis Figures 3 and 4 depict UT and XCT results for samples of SS316L and SS316 + bronze, respectively. The SS316L sample had a pore volume fraction of 0.52 with an average pore radius of 44.1 μm, and the SS316 + bronze sample had a pore volume fraction of 0.49 and an average pore radius of 51.3 μm. For the XCT results, projections of the internal porosity within the gauge region are shown with each pore color coded according to size. For the ultrasound results, attenuation and wave speed are mapped across the same area and plotted on the same scale as the XCT results. Additionally, optical micro- graphs are shown for selected areas on each sample in Figure 5 depicting porosity and grain structure. In the SS316L sample (Figure 3), large pore networks were observed in XCT the interconnected porosity is a result of incomplete sintering of neighboring particles (German 1996). In general, the areas with the largest pores correspond with regions of high attenuation, most clearly observed on the pore network near the center of the sample, which has the same general shape seen in the XCT results. These regions display attenuation values more than double the average across the 10 × 107 μm3 1500 Np/m 6200 m/s 6000 m/s 5800 m/s 5 mm 1000 Np/m 500 Np/m 6 × 107 μm3 2 × 107 μm3 Figure 3. SS316L sample: (a) XCT pore reconstruction (b) attenuation (c) wave speed. A P R I L 2 0 2 2 • M A T E R I A L S E V A L U A T I O N 41
ASNT grants non-exclusive, non-transferable license of this material to  .
All rights reserved. © ASNT 2026. To report unauthorized use, contact: customersupport@asnt.org