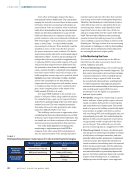
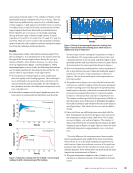
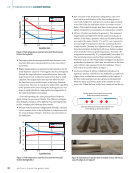
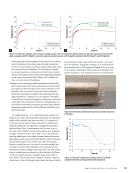
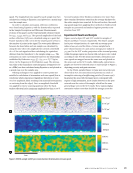
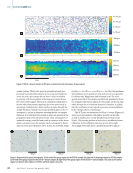
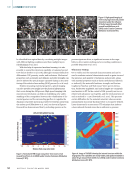
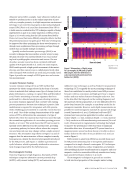
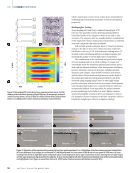
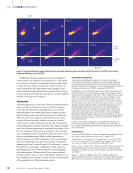
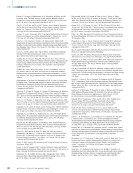
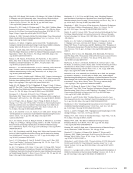
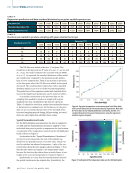
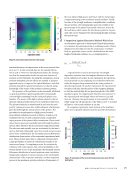
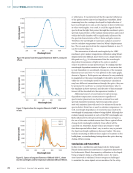
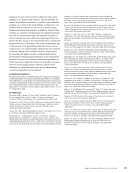
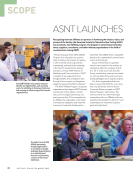
standard deviation of temperatures in the noncorrected data set is 109 °C. In the corrected data set, the standard devia- tion is 32.8 °C. However, this adjustment makes the assump- tion that the temperature should not vary as a function of position on the build plate. In using this assumption, all real position-dependent process effects are masked. A superior approach may be to improve the optical hardware, such that position-dependent optical transmission is reduced, using knowledge of the source of the position-variation pattern. The presence of the patterns can be reasonably attributed to optical interference patterns produced by the partially coherent light emanating from the melt pool/plume com- bination. The source of the light is always related to that of the laser, which provides the power to melt the powder bed. The infrared radiation is transformed in and near the melt pool by various processes into visible radiation, which propa- gates back through the optical system of the printer. The procedure for transformation of high-power, focused, near-infrared radiation proceeds as follows. A melt pool is established by the focused radiation having considerable vapor pressure of the printed alloy constituents. These metal vapor atomic species are partially ionized through the photo- electric effect driven by the focused laser’s high electric field. The electrons and metallic ions are accelerated by the laser’s electric field and collisionally excite the neutral atoms to states above those established by the thermally induced Boltzmann distribution characteristic of the somewhat superheated melt pool. These excited states due to collisional excitation have a high probability of radiation with lifetimes usually in the nanosecond range. A competing process, de-excitation by collisions with cooler species, has a lower probability as the system density is low. In the meantime, the thermally excited Boltzmann distribution of metal quantum states contributes background radiation of a lesser amount at the wavelength’s characteristic of the respective materials. Another important process is the nonlinear optical production of harmonics of the near-infrared high-power melt laser with the metal vapor components acting as the nonlinear optical medium. Finally, because of the strongly nonlinear, nonequilibrium conditions that are present, the emerging light spectrum (visible in the spectroscopy of the plume) has partial coherence, driven by the melt laser, which causes the interference patterns. In prin- ciple, this can be eliminated by depolarizing the light entering the optical train. Comparison Against Alternative Method: Wien’s Law An alternative approach to bichromatic Planck thermometry is to measure the entire spectrum of a radiating source. Wien’s displacement law indicates that the temperature of a black- body (or graybody) source can be calculated from the wave- length of maximum radiance (λmax) using Equation 9: (9) T = 2.898!10 3 m!K " max A spectrometer is used to measure the wavelength- dependent emission from the tungsten filament at the same seven calibration set points. In one experiment, the spectrom- eter was placed on axis, replacing one of the photodetectors, while the tungsten lamp remained in the same position as described previously. In another experiment, the spectrometer was placed off axis, directly in front of the tungsten filament, so that the emitted light did not pass through all of the LPBF machine’s optics. For temperatures between 1300 and 1900 °C, the expected peak wavelength values are between 1333 and 1842 nm. However, the spectrometer is most sensitive in the visible range the off-axis spectra of the bulb at 1600 °C is found in Figure 9, with a peak radiance at 716 nm. In a separate experiment, each element of the machine’s optics were separately characterized for spectral transmittance 200 150 100 50 1.2 1.1 1.0 0.9 0.8 0.7 0.6 X position (mm) 25 50 75 100 125 150 175 200 225 Figure 8. Correction values from the ratio image. 200 150 100 50 2100 2000 1900 1800 1700 1600 1500 1400 X position (mm) 25 50 75 100 125 150 175 200 225 Figure 9. Scatterplot of the corrected temperature data over the full build plate. A P R I L 2 0 2 2 • M A T E R I A L S E V A L U A T I O N 71 Y position (mm) Y position (mm) Temperature (ºC) Temperature (ºC)

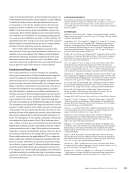
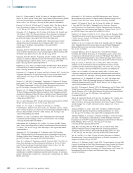
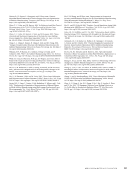
or reflectance. It was determined that the spectral reflectance of the galvanometer mirrors had significant variability, likely stemming from the coatings developed for high reflection of laser wavelength (1070 nm), at the expense of altered reflection at other wavelengths. As a result, it could be argued that the spectra from the light that passes through the machine’s optics, spectral characteristics of the radiant emission from any source within the build chamber will be significantly influenced by the spectral characteristics of the F-theta and galvo mirrors. Therefore, the wavelength of maximum radiance cannot be used to calculate temperature based on Wien’s displacement law. The on-axis spectra from the tungsten filament at 1600 °C can be found in Figure 10. The attenuation of infrared wavelengths by the LPBF machine’s optics makes temperature calibration using Wien’s displacement law difficult, since there is not a single discern- ible peak nor λmax. It is demonstrated that the wavelength- dependent transmission of light in the optics is another source of noise for on-axis spectroscopy. To confirm that the wavelength-dependent variation in Figure 10 is not noise but is truly dependent on wavelength, the spectra of the tungsten filament at 1500 and 1600 °C were plotted on the same graph, shown in Figure 12. Both spectra are observed to vary similarly in magnitude at the same wavelength. It should be noted that while the two wavelengths used for temperature calculation may have different transmittances through the optics, they can be presumed to each have a constant transmittance (due to the similarity in these spectra), and the ratio of their transmit- tances will be absorbed into the regression variable A. Additional sources of uncertainty for spectroscopy- dependent temperature measurements regardless of spectrometer placement are electron emission lines and spectral emissivity variations. Spectroscopy peaks associ- ated with emission lines will need to be subtracted from the spectra before Wein’s law is used to calculate temperature. As well, wavelength dependance of emissivity may result in the wavelength of maximum radiance being shifted. Although the radiated energy measured at each of the TEP wavelengths are likely influenced by the spectral features shown in Figure 11, the use of the ratio method means that if these optical effects change both wavelengths similarly, these effects will be canceled out. Therefore, future work is necessary to verify that these spectral effects don’t vary in such a way to perturb the dual-wavelength calibration discussed earlier. This may include measuring at different laser angles or locations on the build plane, or standardizing/testing when the optics heat up during AM processing. Conclusions and Future Work In this work, a justification and framework for bichromatic Planck thermometry are introduced. A regression framework for bichromatic Planck thermometry calibration is developed. Using a tungsten lamp as a blackbody source, the regres- sion framework is validated. Sensor setups are challenged to maintain the same signals across machines. In the setup 12 000 10 000 8000 6000 4000 2000 0 Wavelength (nm) 200 400 600 800 1000 Figure 10. Spectra from the tungsten filament at 1600 °C, measured off axis. ME | MELTPOOLMONITORING 12 000 10 000 8000 6000 4000 2000 0 Wavelength (nm) 200 400 600 800 1000 Figure 11. Spectra from the tungsten filament at 1600 °C, measured on axis. 12 000 10 000 8000 6000 4000 2000 0 Wavelength (nm) 200 400 600 800 1000 1500 ºC 1600 ºC Figure 12. Spectra of tungsten filament at 1500 and 1600 °C, shown near the wavelengths used for temperature calibration (680 and 700 nm). 72 M A T E R I A L S E V A L U A T I O N • A P R I L 2 0 2 2 Intensity (counts) Intensity (counts) Intensity (counts)
ASNT grants non-exclusive, non-transferable license of this material to  .
All rights reserved. © ASNT 2026. To report unauthorized use, contact: customersupport@asnt.org