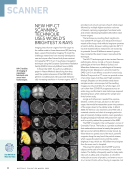
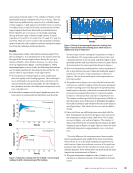
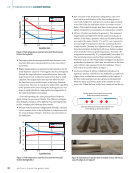
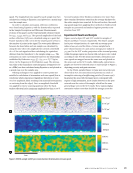
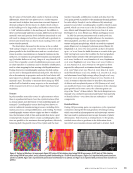
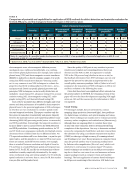
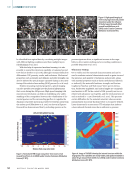
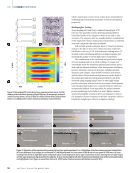
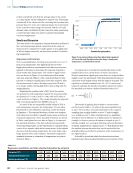
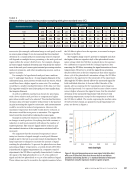
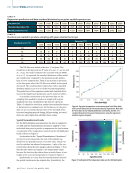
speed. The longitudinal wave speed for each sample was then calculated according to Equation 1 and plotted as a spatial map over the sample area. In order to calculate attenuation, reflection coefficients were found using Equation 5 with the density values reported in the Sample Description and Ultrasonic Measurements sections of this paper and the experimentally obtained values for csilica, csample, and cwater. The spectral amplitudes of the back surface reflection, |Γ(f)|, were calculated using an n-point fast Fourier transform with n set to be the nearest power of two to the number of points in the signal. The water path difference between the fused silica and test sample was calculated by using the time where the amplitude first crossed a threshold of 0.1 V for each signal and then calculating the equivalent distance from the transducer to the sample using cwater.. The attenuation in water was estimated based on the relationship established by Pinkerton: αwater (f) = (25.3 × 10⁻¹⁵)f 2 Np/m, where f is the frequency in Hz (Pinkerton 1949). The attenua- tion value at the transducer center frequency (estimated to be 22.4 MHz) was then calculated using Equation 4 and plotted as a spatial map over the sample area. Filtering techniques were applied to remove points not suitable for calculation of attenuation and wave speed (that is, waveforms which experienced significant distortion or were very low amplitude, likely resulting from material heterogeneity or scattering from the edges). First, an amplitude threshold was applied to remove scanning positions where the back- surface reflection had a maximum amplitude less than 0.008 V. Second, locations where thickness estimates were more than three standard deviations away from the average thickness for the entire sample were removed. In the next section, the result- ing spatial maps from applying these methods to binder-jetted samples are presented and analyzed against porosity recon- struction from XCT. Experimental Results and Analysis Figures 3 and 4 depict UT and XCT results for samples of SS316L and SS316 + bronze, respectively. The SS316L sample had a pore volume fraction of 0.52 with an average pore radius of 44.1 μm, and the SS316 + bronze sample had a pore volume fraction of 0.49 and an average pore radius of 51.3 μm. For the XCT results, projections of the internal porosity within the gauge region are shown with each pore color coded according to size. For the ultrasound results, attenuation and wave speed are mapped across the same area and plotted on the same scale as the XCT results. Additionally, optical micro- graphs are shown for selected areas on each sample in Figure 5 depicting porosity and grain structure. In the SS316L sample (Figure 3), large pore networks were observed in XCT the interconnected porosity is a result of incomplete sintering of neighboring particles (German 1996). In general, the areas with the largest pores correspond with regions of high attenuation, most clearly observed on the pore network near the center of the sample, which has the same general shape seen in the XCT results. These regions display attenuation values more than double the average across the 10 × 107 μm3 1500 Np/m 6200 m/s 6000 m/s 5800 m/s 5 mm 1000 Np/m 500 Np/m 6 × 107 μm3 2 × 107 μm3 Figure 3. SS316L sample: (a) XCT pore reconstruction (b) attenuation (c) wave speed. A P R I L 2 0 2 2 • M A T E R I A L S E V A L U A T I O N 41

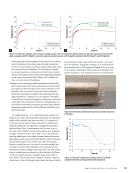
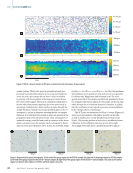
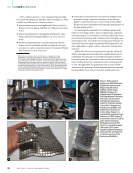
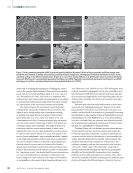
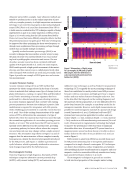
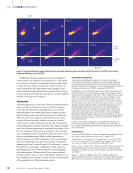
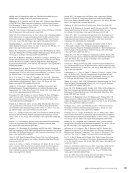
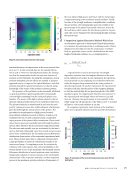
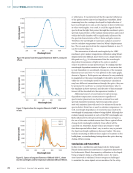
sample volume. While wave speed is generally inversely pro- portional to porosity (Slotwinski et al. 2014 Qu and Cherkaoui 2006), the wave speed maps do not show a clear correlation to porosity, with the exception of the large pore network near the center of the sample. The lack of correlation is likely due to factors other than porosity impacting the wave speed, such as anisotropy resulting from a finite number of grains through the sample thickness. Optical microscopy identified grains to be on average 210 ± 110 μm in diameter, meaning that for our sample thickness, it is estimated that around 14 grains are present in the propagation path of the ultrasonic beam. Thus, assumptions of statistical isotropy would fail and result in variations in the mean elastic constants across the sample, which correspond to fluctu- ations in wave speed (Johnson 1986). In fact, for an SS316L single crystal (c11 = 206 GPa, c12 = 133 GPa, c44 = 119 GPa), the maximum and minimum wave speeds are 6284 and 5074 m/s, respectively (Ledbetter 1983 Kupperman and Reimann 1978). The wave speeds observed in this sample are effectively bounded by these two estimates with the exception of a few points on the top edge which diverge due to waveform distortion. Therefore, it is likely that the correlation of wave speed to porosity is being inhibited by the stronger effects of anisotropy. The XCT pore reconstruction for SS316 + bronze (Figure 4a) shows a porosity gradient, with higher porosity on the right, as well as smaller, more evenly distributed pores than in the SS316L. The porosity gradient is likely due to insufficient bronze infiltration, as the infiltration direction is from left to right. Accordingly, UT results show a gradient from left to right in Figure 5. Representative optical micrographs: (a) left end of the gauge region for the SS316L sample (b) right end of the gauge region for SS316L sample (c) left end of the gauge region for the SS316 + bronze sample (d) right end of the gauge region for the SS316 + bronze sample. In 5c and 5d, the yellow regions are bronze, blue regions are SS316, and black regions are pores. 500 μm 500 μm 500 μm 500 μm 10 × 105 μm3 14 × 105 μm3 350 Np/m 250 Np/m 150 Np/m 5325 m/s 5275 m/s 5250 m/s 5300 m/s 6 × 105 μm3 2 × 105 μm3 5 mm Figure 4. SS316 + bronze sample: (a) XCT pore reconstruction (b) attenuation (c) wave speed. ME | BINDERJETAM 42 M A T E R I A L S E V A L U A T I O N • A P R I L 2 0 2 2
ASNT grants non-exclusive, non-transferable license of this material to  .
All rights reserved. © ASNT 2026. To report unauthorized use, contact: customersupport@asnt.org