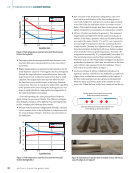
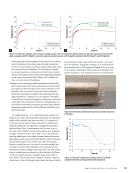
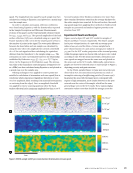
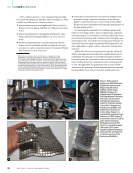
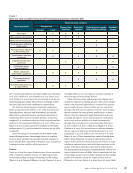
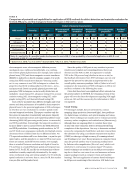
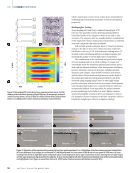
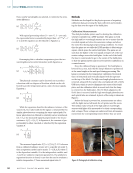
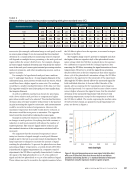
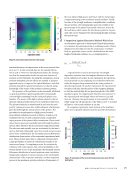
For focused transducers, this expression is satisfied when using the same transducer for both measurements (that is, the same focal length in water, F) and by setting the material path (MP) equal to the sample thickness (by focusing on the back surface of each sample) since WP = F – (csample/cwater)MP. From these two measurements, the attenuation can be calcu- lated by: (4) " sample f ( ) = 1 2t sample ln’ ! sample f # % R2 Ref # $1 % &RRef ( ) ! Ref f # % 1 R2 sample # $ % & Rsample ( )( # $ ’ ’ % & ( ( +" water f ( ) WP Ref WP sample ( ) t sample where |Γ(f)| is the spectral amplitude of the back surface reflection, R is the reflection coefficient at the solid-water interface, and αwater is the attenuation in the water. At normal incidence, the reflection coefficients can be cal- culated by: (5) R = csolid!solid cwater!water csolid!solid + cwater!water where ρ is the density of the sample or water, and “solid” refers to the sample or the reference. In the next section, the sample materials used in this study are described, and the methods used to generate 2D maps of longitudinal wave speed and attenuation are explained in detail. Experimental Testing The results presented herein were obtained through careful control of experimental parameters and post processing of the data. The following section includes a comprehensive descrip- tion of the steps taken to produce both UT and XCT results, as well as relevant information about sample fabrication and preparation. Sample Description SS316L and stainless steel 316 infiltrated with bronze (SS316 + bronze) blocks (25 × 25 × 50 mm3) were fabricated via binder jet AM . SS316L powder with 90 particles below 22 μm size was used to fabricate the SS316L block, while SS316L powder with a diameter range of 20–53 μm was used to create the green part which was subsequently infiltrated with bronze. The powder compositions are given in Table 1. The bulk density of SS316L is 8000 kg/m3, and the bulk density of the SS316 + bronze with 40 bronze is 8304 kg/m3 by rule of mixtures (Gong et al. 2018). Electrical wire discharge machining was used to extract one tensile specimen from each block, as indi- cated in Figure 2. The specimens were polished using standard metallographic grinding and polishing techniques with silicon-carbon SiC abrasive disks and a final polish using a 0.05 μm alumina gamma suspension. Polished samples were ultrasonically tested and then imaged using XCT as described in the following sections. X-ray Computed Tomography Measurements The SS316L and SS316 + bronze tensile specimens were scanned using a multi-scale nano/microCT system to observe pore morphology along the entirety of the gauge region with a voxel size of 10 μm. In XCT, the sample rotates on its axis while being exposed to the source-generated X-rays (Wilson-Heid et al. 2019). As the X-rays irradiate the material, they will be attenu- ated depending on the spatial differences in electronic density and mass, with the transmitted X-rays detected by a 2D detector (du Plessis et al. 2018). The 2D projection data are then used to reconstruct the volumetric data for quantitative analysis. Here, 900 images were taken while rotating the sample 360° with an X-ray exposure time of 500 ms per image. The raw XCT data sets were imported into ImageJ to convert the 32-bit recon- structed volume projection into 2D images, which were pre- processed and adaptively thresholded for porosity based on the average intensity of the surrounding pixels in MATLAB (R2021a) (Bradley and Roth 2007). The images were then read into Avizo (v. 2020.2) for pore reconstruction and analysis. Indications of pores were uniquely labeled for quantitative analysis, and those with volumes less than 27 000 μm3 were removed. T A B L E 1 Chemical compositions of the SS316L and bronze powders used in this study (wt%) Type 1 (SS316L) Fe Cr Ni Mo Mn Si C O N Balance 17 12 2.5 1.5 0.8 0.01 0.06 0.1 Type 2 (SS316L) Fe Cr Ni Mo Mn Si C P S Balance 16–18 10–14 2–3 ≤2 ≤1 ≤0.03 ≤0.045 ≤0.03 Bronze Cu Sn 90 10 A P R I L 2 0 2 2 • M A T E R I A L S E V A L U A T I O N 39

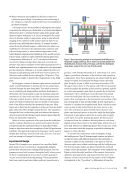
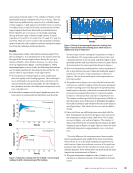
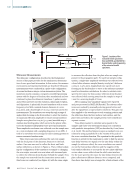
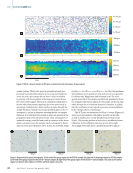
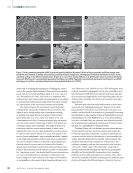
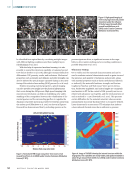
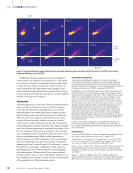
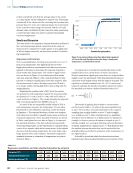
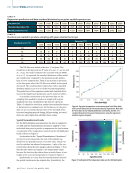
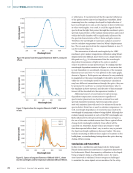
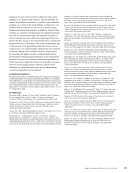
Ultrasonic Measurements The ultrasonic configuration described in the Background section of this paper provides for the simultaneous determina- tion of wave speed and attenuation. In this section, the measure- ment system and experimental details are described. Ultrasonic measurements were conducted in a pulse-echo configuration at normal incidence using a custom immersion system. The immersion system contains a computer-controlled positioning system with five degrees of freedom, three translational and two rotational, to place the ultrasonic transducer. A pulser-receiver and a DAQ card were used for excitation, ultrasound reception, and digitization. A spherically focused transducer with a center frequency of 25 MHz, nominal element diameter of 0.25 in. (6.35 mm), and a focal length of 1 in. (25.4 mm) was used in the measurements. The transducer was swept through a range of angles while focusing on the front surface to select the location of maximum reflection amplitude to ensure normal incidence. Samples were placed on 0.125 in. (3.175 mm) standoffs atop a stainless steel leveling plate, which served as the planar reflec- tor for the thickness-independent wave speed measurements. Time-amplitude waveforms were collected over the sample area at 0.1 mm resolution with a sampling frequency of 500 MHz. A total of 15 waveforms were averaged at each scanning position to remove unwanted random noise. Three total scans were performed for each test sample with the focal point of the ultrasonic beam set to the back surface. One scan was used to collect the front- and back- surface reflections, as shown in Figure 1a. Then, without adjust- ing the configuration of the transducer or sample or changing the scan origin, a second scan was taken with increased gain to collect the reflection from the plate behind the sample. Next, the sample was removed from the immersion system and a third scan was conducted (see Figure 1b) with the same origin to measure the reflection from the plate when no sample was present in the propagation path. For each test sample config- uration, a single time-amplitude waveform was collected over a fused silica reference sample (density 2214 kg/m3, thickness 0.0625 in. [1.5875 mm], longitudinal wave speed 6026 m/s) focusing on the back surface to serve as the reference measure- ment for attenuation calculations. In order to calculate wave speed in the water, the front-surface reflection from the plate was collected while moving away from the sample in steps of 1 mm for a scanning length of 8 mm. After scanning, time-amplitude signals were exported and post-processed in MATLAB (R2018b). The relevant reflec- tions were isolated by manually selecting points before and after the signal from a representative waveform. This gate was then applied to the waveforms at each scanning position and the reflections from the front surface, back surface, and the plate with and without the sample present were isolated into separate vectors. Time delays needed to calculate wave speeds in the samples and water were determined using cross correlation with parabolic interpolation (CPI) as described by Costa-Junior et al. (2018). This method improves upon a standard cross cor- relation by using a parabolic fit in the vicinity of the peak of the cross-correlation function. The equation for this parabolic function is solved for the maximum in order to find the precise time delay between two signals. For the time delay within the sample (or reference silica), the cross correlation was carried out on the front-surface reflection and the negative of the back-surface reflection to account for the 180° phase shift that occurs when a wave reflects from the solid-water interface. For the wave speed in the water, the time delays between the plate reflections at different distances were computed, and then these time delays were averaged for a final estimate of the 16.43 mm 1.5 mm 10 mm 10 mm Sample R3.94 3.94 mm 46 mm 11.85 mm 6.57 mm Sample Figure 2. Locations of the extracted tensile specimens from (a) SS316L and (b) SS316 + bronze blocks and (c) geometry of the extracted tensile specimens. ME | BINDERJETAM 40 M A T E R I A L S E V A L U A T I O N • A P R I L 2 0 2 2 Vertical build direction
ASNT grants non-exclusive, non-transferable license of this material to  .
All rights reserved. © ASNT 2026. To report unauthorized use, contact: customersupport@asnt.org