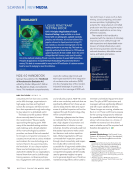
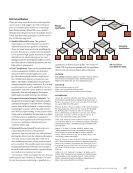
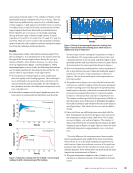
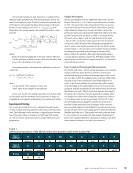
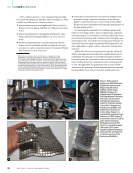
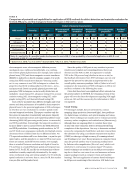
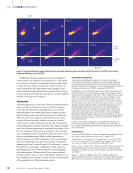
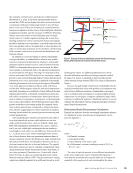
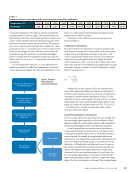
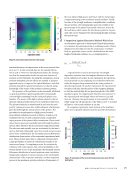
(for example, nominal versus anomalous) is shift-invariant (Bronstein et al. 2021). It has been experimentally demon- strated that CNNs are less fragile than their nonconvolutional counterparts while processing image-based in situ AM data (Snow et al. 2021). If there are deviations in nominal/anoma- lous process signals over the course of the build plate, then this assumption is broken, and the accuracy of CNNs for detecting defects across the entirety of the build plate may be signifi- cantly reduced. A similar argument nonspecific to any deep learning architecture can be constructed: that process signals should be uniform across machines, or models trained on data from one machine will not be applicable to other machines. In order to ensure data uniformity across machines, all else being held constant, sensors need a universal standardization (cali- bration) scheme. In addition to concerns relating to system repeatability and reproducibility, a standardization scheme may enable reference to physical temperature by relating to a thermally calibrated radiant emission source. Laser powder bed fusion (LPBF) is a thermally driven process, and as such, the fabri- cation quality is intrinsically tied to the physical temperatures in and around the melt pool. The range of temperatures that exist in and around an LPBF melt pool are extremely complex, known to span several thousand degrees Celsius (Hooper 2018 Deisenroth et al. 2021), and include a multitude of thermally radiating phenomena such as hot particle spatter (Khairallah et al. 2016), plumes (Dunbar and Nassar 2018), reflections, and the like. While singular values for melt pool temperature inevitably superimpose a multitude of these different thermal radiating phenomena, a thermally standardized system may still enable computation of temperature-based data features such as radiance temperature, cooling rates, or thermal gradi- ents. In turn, these physics-based thermal metrics may offer greater sensitivity to processing quality (for example, devia- tions in these metrics may correspond to AM process devia- tions, thereby supporting more robust statistical or machine learning–based models for practical process monitoring and control applications). One standardization scheme is proposed by the authors for a dual photodiode system, which utilizes two on-axis single-point photodetectors, each one behind a band-pass filter with transmission chrematistics of λ2 and λ1, where λ2 and λ1 are two visible light wavelengths that are similar in wavelength to each other ( 50 nm difference between the two, λ1 λ2) (Lane et al. 2020). These wavelengths were chosen due to their distance from any prominent emission lines of metals commonly used in the AM process. Light emitted from the melt pool with these wavelengths is therefore not due to electron transition but due to thermal radiation. The signals from these sensors are used to calculate a temperature value using bichromatic Planck thermometry (ratio, dual-band, or two-color pyrometry) (Saunders 2007 Coates 1981), which forms the basis of a process monitoring data metric called thermal emissions Planck (TEP). The photodetectors’ analog outputs are digitally sampled at 200 kHz and stored as 32-bit floating point values. An additional photodetector, whose thermal calibration was discussed using a separate method by Lane et al. (2020), is sampled to derive another metric called thermal energy density (TED). The setup is illustrated in Figure 1. Because the path length of melt pool–emitted light into the coaxial photodetectors varies with position and variations may exist between different machines, standardization is import- ant to normalize melt pool signals to a physical phenomenon: temperature. In this paper, a tungsten calibration lamp, which is known to sufficiently replicate a blackbody emitter, is used to calibrate the photodiode system using the principles of bichro- matic Planck thermometry. Bichromatic Planck Thermometry Calculations Planck’s law indicates that the wavelength-dependent radiance of a blackbody source as a function of temperature can be given by Equation 1: (1) I(!,T) = 2hc2" !5 1 e hc ! kBT 1 where h is Planck’s constant, c is the speed of light, ε is the emissivity of the source, and kB is Boltzmann’s constant, resulting in units of I(λ,T) as W × sr−1 × m−3. The ratio of emitted intensity at two different wavelengths at the same temperature can be calculated by Equation 2. Note that the emissivity value cancels itself out, so long as the emissivity of the melt pool at each wavelength is the same. Beam splitter 1 Beam splitter 2 Beam splitter 3 F-theta lens X X Y Y Melt pool Heating laser TED sensor TEP sensor, λ 1 TEP sensor, λ 2 Heating laser Scanning galvo mirror system Radiant emission from melt pool Figure 1. Diagram of the dual photodiode system with thermal energy density (TED) and thermal emissions Planck (TEP) sensors. A P R I L 2 0 2 2 • M A T E R I A L S E V A L U A T I O N 65

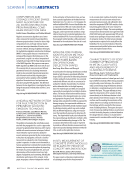
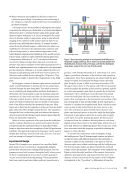
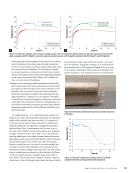
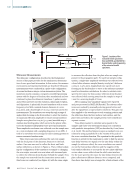
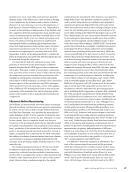
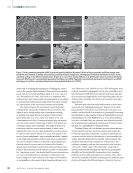
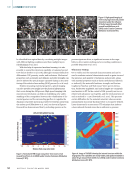
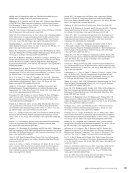
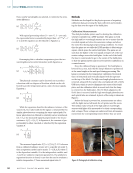
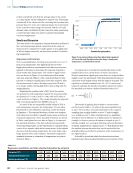
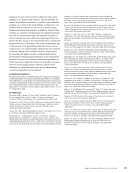
Here, nearby wavelengths are selected, to minimize the emis- sivity difference: (2) I(! 2 ,T) I(! 1 ,T) = ! 1 !2 " # & $5 % ’ e hc !1 kBT 1 e hc ! 2 k B T 1 With typical processing values (T = 1900 °C, λ ≈ 500 nm), the exponential term is considerably larger than 1 (ehc/λkBT ~ e7 ب"1) and the equation can be reduced to Equation 3: (3) I 2 ,T) ( I 1 ,T) ( = 1 2 ! " % #5 $ & e hc 1 kBT e hc 2 k B T Rearranging this to calculate temperature given the two wavelengths and recorded intensities yields Equation 4: (4) T = hc(" 2 "1) " 2 " 1 ln+ I#" 2 ,T% I#" 1 ,T% !, 2 #" $"1& %5 . ’ ( + ) * - - The physical constants can be factored out to produce a function with two degrees of freedom, which can be cali- brated to predict temperature given a ratio of sensor signals, Equation 5: (5) T = A ln) B I 1 ,T# ! I 2 ,T# ! % & ) ) ’ ( * * * While the equations describe the radiance/exitance of the source (I[λ,T]), it also holds for the signal, S, measured by two similar photodetectors occupying the same optical path. For linear photodetectors, filtered to relatively narrow wavebands (Δλ ا λ0), the measured signal is proportional to the source emittance: S0(T) ∝ I(λ0,T). In Equation 6, the constant of pro- portionality is either canceled or absorbed by the regression variable B: (6) T = A ln B S 1!T" S 2!T" $ % ( ( ( & ’ ) ) ) The measured signal ratio R(T) = S1(T)/S2(T). If T is known from a calibrated radiance source set to a specific set point Ti, then a regression model can be made: Ti = f (Ri,A,B), where Ti is the dependent variable, Ri is the independent variable, and A and B are unknown regression parameters. If a satisfactory regression function is found, it can then be used to evaluate a relative temperature, T, from measured signal ratio, R. Methods Methods are developed for the physics process of acquiring calibration data, processing the data collected, and normaliz- ing the data over the span of the build plate. Calibration Measurements The dual photodiode system used to develop the calibration scheme is installed on a LPBF machine. The gains on both the high and low wavelength sensors are set to ensure that the recorded signals are below the saturation voltage and above the noise floor during typical processing conditions. To ensure this, the gains are set while the LPBF machine is fabricating a square, which spans the entire build plate. The gains are set such that the higher of the two signals averages 75 of the sat- uration voltage across the build plate. At the end of the build, the laser is commanded to go to the center of the build plate, so that the galvanometer mirrors are focused for calibration on a central source. Next, the calibrated lamp is positioned. The build plate is lowered by 45 mm, such that the lamp’s filament is positioned at the same height as the melt pool during processing. The lamp is contained in the temperature calibration block such that it is horizontal and vertically aligned with the aperture on the top of the block. The high wavelength photodetector is removed, along with the optics tube, and replaced with a HeNe USB laser, which is used to illuminate the center of the build plate, and the calibration block is moved such that the lamp is centered on the build plate. After XY block alignment, the HeNe laser is removed and the high wavelength photodetector and optical tube are returned. A photo of the setup is shown in Figure 2. Before the lamp is powered on, measurements are taken with the lights turned off inside the 3D printer and the room. The median value of each of the high and low wavelength sensors with lights off is measured to be their corresponding dark voltages. These voltages are subtracted from all measure- ments from the corresponding sensors before they are used Figure 2. Photograph of calibration setup. ME | MELTPOOLMONITORING 66 M A T E R I A L S E V A L U A T I O N • A P R I L 2 0 2 2
ASNT grants non-exclusive, non-transferable license of this material to  .
All rights reserved. © ASNT 2026. To report unauthorized use, contact: customersupport@asnt.org