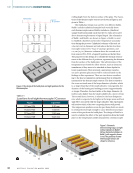
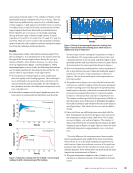
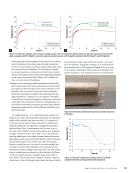
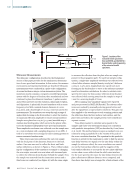
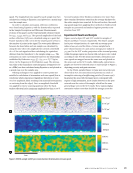
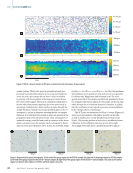
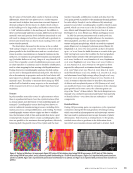
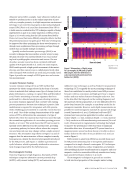
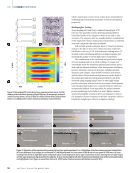
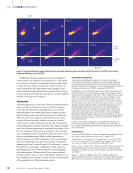
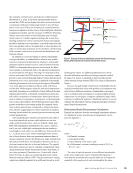
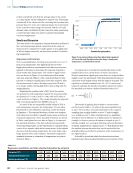
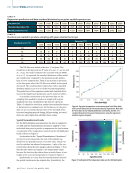
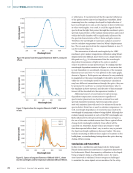
sensor placed directly under it. The cylinder in Build 2 is built horizontally and has a diameter of 2.16 cm (0.85 in.). They are offset from the build plate by 5 mm (0.20 in.) tall fully dense volume supports. A grid support (50 hollow) was not used as it would provide an inferior thermal conductivity and weaker support against distortions from built up residual stresses. These cylinders are 13.46 cm (5.3 in.) in length, spanning the gap between a pair of thermocouple sensors of equal Z position (TC1 and TC5, TC2 and TC6, TC3 and TC7, and TC4 and TC8). They are used to monitor the temperature develop- ment at both ends of the cylinder and their anticipated separa- tion from the build plate during production. Results The temperature profile collected from thermocouple TC1 is shown in Figure 4. It is representative of the pattern observed through all the thermocouple sensors during the 30 h pro- duction of Build 1. More detail is shown in a 0.5 h (30 min) close-up segment from Figure 4, shown in Figure 5. When examining Figures 4 and 5 closely, the following observations can be made regarding the heat pattern detected by the TC1 sensor, which is representative of all eight sensors. The temperature reading begins at room temperature and rises rapidly as the build progresses. The initial rapid rise is attributed to the proximity of the melt layer to the sensors when the part is being built, the short height of the cylinders, and the cold build plate temperature at the start of production. As the build continues and the part’s height increases, the heat source is continuously moved farther away from the thermocouple sensors, causing the temperature to drop at the build plate. The temperature peaks between the 1 and 3 h marks, plateaus at the 5 h mark, and then begins to drop gradually until the end of production at the 30 h mark. This is demonstrated in the unaveraged data shown in Figure 4. The cool-down factor is relatively slow. At the conclusion of the 30 h production process, it takes the build plate approx- imately 5 h to return to room temperature, as shown in Figure 4. The rise from and drop to room temperature are both exponential. The peaks seen in Figure 5 are caused by the heat from the melt process, and the troughs are from the pause during the powder recoating cycle. Each data point is represented by a small square on the plot, collected at 12 s intervals. Five data points are encompassed between two consecutive peaks in Figure 5. This means that each layer is deposited in 60 s. The unique condition provided by the geometry of Build 1 is that the surface areas of the layers at all heights throughout the build are identical and will have the same melt duration and elapsed time. This will not be the case with the Build 2 design. Once every hour, an additional pause associated with the filter cleaning process increases the pause time and causes the temperature trough to drop a little lower. These drops are seen in Figure 4, as well as in Figure 5. The number of data points between the two peaks that encompass the filter cleaning trough in Figure 5 is eight, which accounts for three additional data points or approximately a 36 s cool-down time. The only difference the remaining seven thermocouple sensor measurements may exhibit from these observations derived from TC1 is in the peak temperature experienced at each location. Figure 6 provides an overview of the peak tem- peratures with respect to the Z position for each sensor and cylinder diameter. A few observations are made from the peak temperature measurements in Figure 6: The peak temperature is highest at the 3.81 mm (0.15 in.) Z position, as expected, because of its proximity to the heat source. Figure 4. Temperature readings from TC1 for Build 1: (a) unaveraged readings (b) with a moving average of five readings. 70 60 50 5 10 15 Time (h) 20 TC1 (unaveraged))g F 25 3530 40 30 20 ( lter cleaning 70 60 50 5 10 15 Time (h) 20 TC1 (average of 5) Filter cleaning 25 3530 40 30 20 50 51 52 53 54 55 56 57 58 5.0 5.1 5.2 5.3 5.4 5.5 Time (h) Filter cleaning pause Figure 5. Closeup of the unaveraged temperature readings from Figure 4. Arrow indicates filter cleaning pause, which results in a slightly lower drop in temperature. A P R I L 2 0 2 2 • M A T E R I A L S E V A L U A T I O N 33 T (°) T (°) T (°)

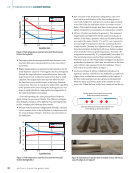
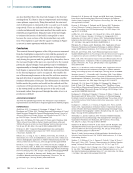
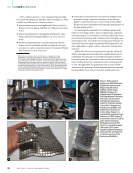
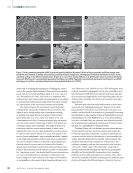
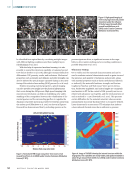
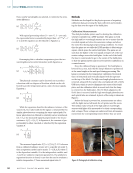
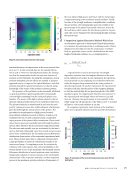
The temperature drops exponentially with distance, such that little difference is measured between the other three Z positions. Higher temperatures are measured at all Z positions for the small-diameter cylinders. This suggests that heat dissipation through the large cylinders is a prevalent factor due to the larger mass of heat-conductive material than that in small cylinders. One might expect the opposite effect because the laser heat source dwells longer at the larger-diameter components. However, it may also be argued that regardless of the position of the laser during the melting process, over large or small cylindrical components, the temperature of the entire build plate is increasing. Generally speaking, the same principals and behavior apply during the process for Build 2. The different configura- tion of Build 2 results in a few differences in the temperature profile, including the following observations: Because of the horizontal configuration of Build 2, the heat source remains close to the build plate in comparison with the vertical design of Build 1. Therefore, more heat flows to the build plate. Also, because of the horizontal configuration, the cross- sectional area and duration of the laser melting process varies with height. The melt process reaches approximately 8 min (480 s) for the mid layers, versus a constant 60 s for Build 1. This results in longer melt times, fewer pauses, and higher temperature accumulations in comparison to Build 1. All four cylinders are identical in geometry. The measured temperatures are expected to be the same for each pair of sensors of the same Z position, which are located under the two ends of the same cylinder. TC1 and TC5 are expected to measure higher temperatures than the remaining thermo- couple sensors. However, the cylinder above TC5 separated from the build plate during the fourth hour, before reaching what would have been its peak temperature. Therefore, the temperature measured by TC5 is significantly lower than TC1. The remaining sensors reached their maximum readings between 5 and 10 h. The temperature reading for each pair is similar but not identical, which may be attributed to the time each cylinder edge separated from the build plate. This is reflected in the profiles shown in Figure 7. As shown in Figure 8, all four cylindrical rods showed a significant amount of liftoff from the build plate around both edges, where residual stress accumulation is the highest. At the start of the melt process, the top layer is extremely hot while the inner and bottom parts of the cylinder are rela- tively cold. When the laser is idle, heat transfers from the top 0.38 0.76 1.14 1.52 75 80 Z position (cm) 70 65 60 55 50 TC5 TC6 TC7 TC8 TC4 TC3 TC2 TC1 Large cylinders Small cylinders Figure 6. Peak temperatures experienced at each thermocouple location during Build 1. 0.38 0.76 1.14 1.52 75 80 Z position (cm) 70 65 60 55 50 TC5 TC6 TC7 TC8 TC4 TC3 TC2 TC1 Large cylinders Small cylinders Figure 7. Peak temperatures experienced at each thermocouple location during Build 2. Cooling creates internal tensile force near top surface from material contraction Heat flow downward prevents internal tensile force from building up near the part bottom Figure 8. Deformation of cylinders due to residual stresses. Net forces cause the edges to curl upward. ME | THERMOCOUPLEMONITORING 34 M A T E R I A L S E V A L U A T I O N • A P R I L 2 0 2 2 Peatemperature(°) k Peatemperature(°) k
ASNT grants non-exclusive, non-transferable license of this material to  .
All rights reserved. © ASNT 2026. To report unauthorized use, contact: customersupport@asnt.org