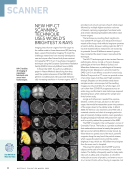
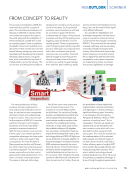
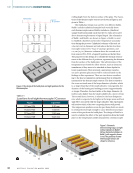
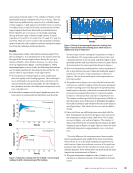
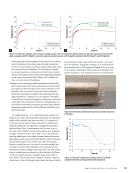
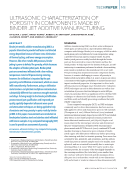
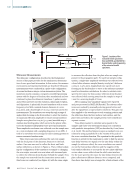
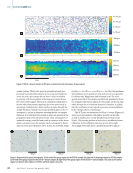
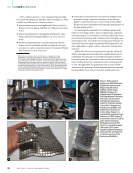
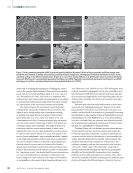
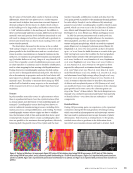
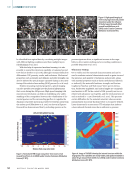
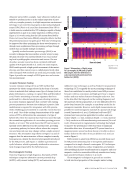
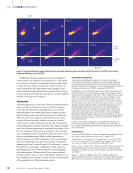
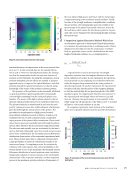
the 3D nature of the builds often results in thermal cooling differentials, where the base plates are at a colder tempera- ture and result in higher heat extraction rates and degrees of thermal cycling for the first layers of a build, which reduces as the builds get to be larger/taller, and further removed from a “cold” substrate relative to the molten pool. In addition to these conventionally understood cracks, differences in the local material’s state and porosity levels (whether intentional or not) will result in changes in heat flow and will lead to gradients in stresses and strains that can lead to local cracking, even in oth- erwise ductile material. The final defect discussed in this review is the so-called “fish scaling” (Figures 2e and 2f). This defect is observed in the planes parallel to the build direction and are a result of vari- ations in solute concentrations or chemical variations in the melt pool, or variations in precipitate formation and morphol- ogy (Sochalski-Kolbus et al. 2015 Tang et al. 2015 Brandl et al. 2012). This is typically a result of solidification processes, such as solute rejection in columnar and/or dendritic solidification, and/or solute trapping for fast-moving solid-liquid interfaces. During destructive metallographic analysis, this fish scaling can be used to distinguish individual melt pools. This defect is also a discontinuity in properties such as the local elastic stiff- ness tensor (Cij), density, composition, and other aspects of the material’s state. The ability to measure these using any NDE method will be limited in many respects, as the wavelength of the measurement devices is much larger than these local variations. Texture In polycrystalline materials, texture is a phenomenon where there is a preferential bias in how the crystal structures (that is, atomic planes and directions) of each individual grain are arranged. Crystallographic texture has long been known to exist in traditional manufacturing processes, including defor- mation processes, casting/solidification, and welding. For those crystallographic textures whose origins are due to solidifica- tion, the literature is full of data and models that show a pref- erential growth of grains where certain crystallographic direc- tions are parallel to the maximum thermal gradients, effectively balancing both the growth rates of the crystals and the heat transfer. Classically, solidification models and data show the [001] grain growth is parallel to the maximum thermal gradient for cubic alloys, though it can be influenced by anisotropy parameters and other crystallographic variables related to grain growth, which can even occur in the [110] direction (Chalmers 1964 Morris and Winegard 1969 Ferry 2006 Liu et al. 2013 Boettinger et al. 2000 Henry 1943 Henry and Rappaz 2000). In AM, the process parameters such as melt-pool size, scanning strategy, and layer height influence the maximum thermal gradient, and thus are mainly responsible for texture and grain morphology, which can result in equiaxed grains (Figure 3a) or elongated columnar grains (Figure 3b) (Haghdadi et al. 2021). The [001] growth can have deviations up to ~10° to 20° from the build direction as a result of the spa- tially varying heat source that modifies the thermal gradient, and this texture persists with subsequent layers (Quintana et al. 2020 Saville et al. 2021 Kamath et al. 2021 Stephenson et al. 2020 Haghdadi et al. 2020 Shao et al. 2020 DeMott et al. 2021 Kumar et al. 2021). Texture in AM parts has been reported for alloys such as titanium-based (Bermingham et al. 2015 Vilaro et al. 2011 Wu et al. 2002 Qiu et al. 2015), nickel-based (Kunze et al. 2015 Dinda et al. 2012 Bi et al. 2014), and aluminum-based high-entropy alloys (Joseph et al. 2015 Sun et al. 2014), among others (Song et al. 2014 Zecevic et al. 2015). As texture is directly related to heat flow, the presence of defects such as spherical pores or LOF (Kenney et al. 2021) can modify the heat vector and the orientation of the columnar grain growth and in some cases, the columnar grains can stop at the “floors” of these defects. This local disruption is an example of a correlated microstructural feature that may help to identify defects—even those that are subsurface—in AM components. Residual Stress During AM processing, parts can experience cyclic expansion/ contraction during the thermal gyrations of heating/cooling, which can result in inhomogeneous and anisotropic stresses that can result in permanent microscopic domains of plastic deformation. This is known as residual stress. To be specific, residual stress refers to gradients in the dislocation densi- ties (which accommodate stresses and lead to strains). Such 300 μm 300 μm 111 001 101 2 cm Figure 3. Texture in AM alloys: (a) inverse pole figure (IPF) plots of 316L stainless steel using 150 W laser power (b) IPF plots of 316L stainless steel using 1000 W laser power and (c) columnar growth and banding in a Ti-6Al-4V tensile coupon. (Figure 3a is reprinted with permission from Laleh et al. [2019] Figure 3b is reprinted with permission from Niendorf et al. [2013] and Figure 3c is reprinted with permission from Carroll et al. [2015].) A P R I L 2 0 2 2 • M A T E R I A L S E V A L U A T I O N 51 Building direction Building direction

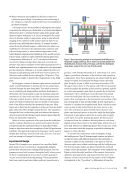
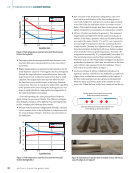
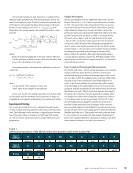
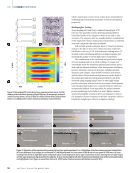
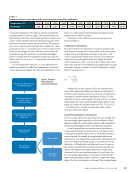
residual stresses can lead to distortions, cracking, and failure (Cottam et al. 2014). Within AM deposited parts, residual stresses can vary within a layer. They have been reported to be different at the bottom of a layer to the top (Denlinger et al. 2014, 2015 Michaleris 2014 Mercelis and Kruth 2006), and have been reported to reach magnitudes such as ~400 to 800 MPa in nickel-based superalloys (Denlinger et al. 2014 Vilaro et al. 2012) or as low as ~25 MPa for aluminum alloys (Brice and Hofmeister 2013). Not surprisingly, given the gradient nature of the local stress/strain states and the typical balancing of stress states, these stresses can be either compressive or tensile in nature, depending upon location (Denlinger et al. 2015 Brice and Hofmeister 2013). Roberts et al. (2009) reported that residual stresses are directly related to thermal gradients in the melt pool, and thus can be controlled by thermal gradients by modifying the printing parameters and scanning strategy. Such residual stresses would be potentially suitable for nonlinear NDE techniques post deposition, although it may be possible to use image-based techniques and machine learning to predict the local residual stress of a component. Compositional Variations In AM, compositional variations can be induced either inten- tionally (such as through controlled modification of the incoming material feed) or unintentionally (such as through volatility of an elemental species in the presence of a vacuum and exposed to significant superheats). In addition to these macroscopic changes in composition of the local melt pool or its surface, the complex fluid flow can convey the different compositional domains (often at flow rates of 0.1 to 1.0 m/s). In addition, for powder bed processes, it has recently been shown that the fluid dynamics are coupled with the convective forces within the molten pool, which can have a considerable influence on the local composition of the solidified material. These fluid dynamics are a function of thermal gradients in the liquid pools and are thus a function of the scan strategies (for example, raster or spot scan strategies). Of the competing fluid-flow mechanisms, Marangoni convection has been shown to be the dominant factor in raster melt pools, as it is driven by temperature gradients. Hojjatzadeh et al. (2019) defined three distinct regions in the raster melt pool: circulation, tran- sition, and laser interaction. In comparison, spot melting melt pools would have only laser interaction regions. This difference explains why gas bubbles more easily escape the melt pool in spot melting strategies and can remain entrapped (and form pores) in raster strategies (Kenney et al. 2021 Quintana et al. 2021). In addition, this coupled effect between defects (gas pores) and compositional fields has been recently confirmed (Kenney et al. 2021), providing another possibility to relate two defects that may be interpretable using different measurement modalities. Fluid flow, in combination with preferential elemental vaporization, is also responsible for a phenomenon known as banding (Figure 3c) and can be observed in optical micros- copy (usually as light and dark bands perpendicular to the build direction) and energy dispersive spectroscopy (capturing bands and chemical turbulent signatures in the presence of defects). Phases Structural, multicomponent engineering alloys often rely on second phases (or phase transformations) for strengthening purposes. Such alloys include γ-γ′ nickel-based superalloys, precipitate hardened steels, precipitate hardened aluminum alloys, and α + β and β titanium alloys. While in traditional manufacturing processes, materials experience a specific sequence of temperature excursions to optimize the phase transformations sequence and evolution of the second phase precipitates, the nature of AM forces the alloys to experience an externally governed number of thermal cycles (through the slicing algorithm) of a rather extensive range of possible tem- peratures, ranging from remelting to “optimal phase transfor- mation windows” to lower temperature heating/coarsening, all of which influence crystallographic texture, grain size, formation–dissolution–formation of precipitates, phase fraction, and formation of nonequilibrium phases, includ- ing noncrystalline phases in some cases. Traditional phase transformation models are not fully valid for AM systems and require modification to incorporate these thermal cycles and their influence in the already printed layers. Compositional variations and banding can also be related to different phases in different locations within a layer, as different chemistry can be related to different regions in a phase diagram. The presence of certain phases, morphologies, phase distribu- tions, or phase fractions can be achieved in some cases only by post-deposition heat treatments. This domain is, on the one hand, perceived as the most difficult to couple with NDE modalities because it is the least mature, and due to the size/ scale of the precipitates. However, it may be that indirect methods can be used to assess phase formation, as the pre- cipitation of one phase will change the crystal chemistry of the parent phase, resulting in changes in the local elastic stiffness tensor, a property that is determinable using NDE techniques. A Review of the Application of NDE Techniques for Additive Manufacturing NDE is a collection of qualitative and quantitative testing methods that are used to evaluate certain characteristics of the subject under test without permanent damage or alter- ation. NDE can provide critical information regarding certain material properties, which plays an important part of provid- ing confidence for qualification and better quality control of the material being used or produced. NDE can also be used on a routine basis to continuously monitor mission-critical (high-value) parts and systems over their lifespans. Rigorously speaking, nondestructive evaluation (NDE), nondestructive testing (NDT), and nondestructive inspection (NDI) do not correspond to the exact same concept, but it has become an acceptable practice to use these three terms interchange- ably. NDE techniques rely on electromagnetic radiation, ME | AMNDEOVERVIEW 52 M A T E R I A L S E V A L U A T I O N • A P R I L 2 0 2 2
ASNT grants non-exclusive, non-transferable license of this material to  .
All rights reserved. © ASNT 2026. To report unauthorized use, contact: customersupport@asnt.org