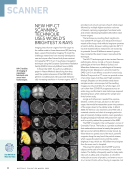
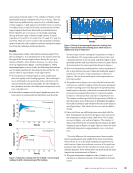
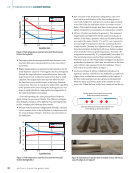
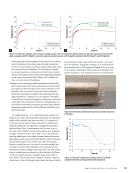
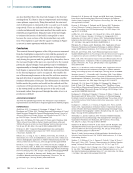
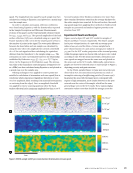
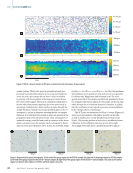
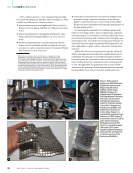
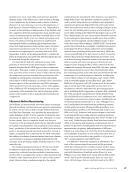
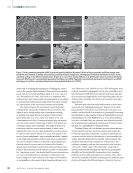
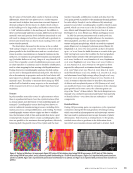
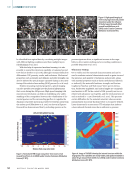
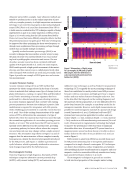
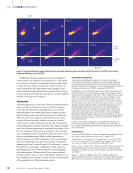
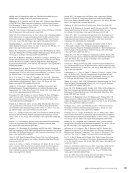
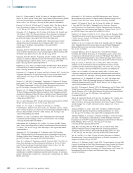
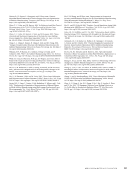
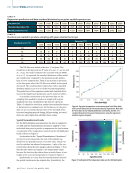
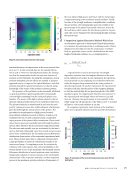
Similar work has been done by Hojjatzadeh et al. (2019), where direct observation and quantification of melt-pool vari- ation during the laser powder bed fusion AM process under constant input energy density is done by in situ high-speed, high-energy X-ray imaging. The results, shown in Figure 10, are important for understanding the laser powder bed fusion AM process and guiding the development of better metrics for pro- cessing parameter design. Thermal/Infrared Testing (IR) IR is an imaging technique that uses the thermal radiation of an object to determine its characteristics (Ida and Meyendorf 2019). Compared with other NDE methods such as UT and RT, IR is fast and can be used to inspect large areas simul- taneously (in other words, scanning is not required). The measured surface radiation can reveal the existence of dis- continuities that affect heat conduction in metal AM parts since surface temperature and its distribution depend on the thermal diffusion of the material as well as the geometry and location of the discontinuities (Mandache 2019). Analyzing layer-by-layer thermal images in terms of the spatial and temporal variations of thermal signatures (for example, peak intensity, decay, and number of gyrations) can be used as a surrogate for defect formation tendency during laser powder bed fusion processing (McNeil et al. 2020). Further, Figure 11 demonstrated that the in situ conclusions can be cross- verified by ex situ X-ray CT (XCT) measurement results (McNeil et al. 2020). Pore Pore Scan direction Scan direction Circulation Transition Laser interaction Figure 10. Single-pulse X-ray images showing pore motion within melt pools: (a–d) pore dynamics during the laser powder bed fusion process and (e–h) pore dynamics during melting of a bare substrate. Pores follow circular patterns during circulation (10a and 10e) they present irregular movement during transition (toward the surface and escaping) (10c and 10g) or circulating in the melt pool (10b and 10f). They move toward the depression zone and escape the melt pool during the laser interaction (10d and 10h). The dotted arrows (10b, 10c, 10d, 10g, and 10h) show the future trajectories of the pores, while the solid arrows (10a, 10e, and 10f) indicate the history of the trajectories. The dashed line indicates the boundaries of the melt pool and the depression zone in 10d and 10h. (Figure reused from Hojjatzadeh et al. [2019] under Creative Commons Attribution License [CC BY].) 16 000 14 000 12 000 10 000 8000 6000 10 12 14 16 18 20 22 24 2 4 6 8 10 12 14 16×10–3 16×10–3 12 8 4 8 12 16 20 Width (mm) Width (mm) 15 mm Figure 11. X-ray computed tomography (XCT) is used as an ex situ characterization technique to provide the cross comparison with data acquired by in situ techniques such as thermal/infrared testing (IR) and optical imaging: (a) ex situ XCT data for layer 309 (b) in situ optical images from the same location showing contrast, which is related to surface irregularities (c–f) in situ IR frames from the same layer within the defect location shown in Figure 11a, captured when the laser completes the raster. (Figure reprinted with permission from McNeil et al. [2020].) A P R I L 2 0 2 2 • M A T E R I A L S E V A L U A T I O N 57 Intensity (counts) Length (mm) Length (mm)

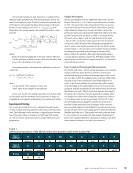
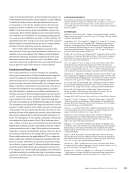
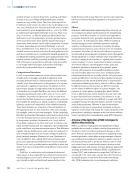
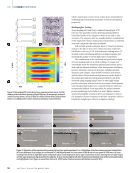
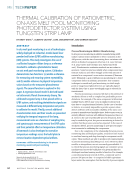
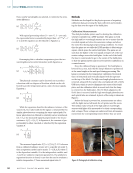
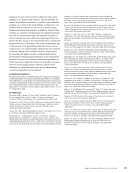
If high-speed thermal cameras are used, it is possible to closely observe the behavior of the melt pool in a time-based series, which could provide invaluable information that helps to understand the AM process. Recent research (Calta et al. 2019) demonstrates that high-speed camera images can be used to resolve thermal emission from spatter events, fluctua- tions in the melt pool itself, the vapor plume, and the solidified track as it cools, as seen in Figure 12. Conclusions This paper has given an overview of both the materials science aspects of AM, as well as the prospects of NDE techniques to provide key information regarding the process. The fun- damental physics associated with AM are complex, and the relevant length scales range from nanometers to centimeters, while the time scales range from sub-microsecond to many seconds. Relevant velocities include not only the obvious “travel speeds” of the AM process, but also the velocity of the solid-liquid interface and the convective flow within the liquid state. Each of these parameters is associated with details of the process and phase transformations that govern the materials state, including deposited composition, grain structure, texture, defects, and residual stress. While it will be impossible to directly measure all of these parameters, there is the prospect that some multilength scale processes will have measurable signatures that can be probed using NDE techniques. A variety of methods and techniques, ranging from visual, ultrasonic, and radiographic (wave-based methods) to electromagnetic and thermographic (diffusion based) have been presented, and have all been shown to offer some benefit, whether it is to understand process variations or make discrete measurements of the materials state. This field remains active. ACKNOWLEDGMENTS The authors acknowledge the support of the Center for Advanced Non-Ferrous Structural Alloys (CANFSA), an NSF Industry/University Cooperative Research Center (I/UCRC) between Iowa State University and The Colorado School of Mines, as well as the support from Center for Nondestructive Evaluation (CNDE), a graduated NSF I/UCRC. Background expertise and related materials have been developed under multiple programs. Currently ongoing programs include research that is sponsored by the Department of the Navy, Office of Naval Research under ONR award number N---. Any opinions, findings, conclu- sions, or recommendations expressed in this material are those of the author(s) and do not necessarily reflect the views of the Office of Naval Research. In this work and for the generation of specimens, access to the additive manufacturing equipment at Oak Ridge National Laboratory’s Manufacturing Demonstration Facility (MDF) was facilitated by the US Department of Energy’s Strategic Partnership Projects (SPP) mech- anism. More information can be found at https://science.energy.gov/ lp/strategic-partnership-projects. Research was sponsored by the US Department of Energy, Office of Energy Efficiency and Renewable Energy, Industrial Technologies Program, under contract DE-AC-OR with UT-Battelle LLC. In addition, materials manufactured using LHW AM materials were produced and tested under ONR contract N--C- (“Robotic Laser Additive Manufacturing System with Comprehensive Quality Assur- ance Framework”). REFERENCES D Systems, , D Printers, Software, Manufacturing & Digital Health- care, https://www.dsystems.com (accessed August ) Abdelrahman, M., E.W. Reutzel, A.R. Nassar, and T.L. Starr, , “Flaw Detection in Powder Bed Fusion using Optical Imaging,” Addit. Manuf., Vol. , pp. –, https://doi.org/./j.addma... Ahsan, F., and L. Ladani, , “Temperature Profile, Bead Geometry, and Elemental Evaporation in Laser Powder Bed Fusion Additive Manufac- turing Process,” JOM, Vol. , pp. –, https://doi.org/./s --- Aldrin, J.C., and E.A. Lindgren, , “The Need and Approach for Characterization-U.S. Air Force Perspectives on Materials State Awareness,” AIP Conference Proceedings, Vol. , https://doi.org/./. Spatter 0 ms 0.780 ms Scan direction 0.936 ms 1.092 ms 1.248 ms 0.156 ms 0.312 ms 0.468 ms Melt pool Vapor plume Solidified track Figure 12. High-speed thermal images collected by the melt pool monitoring camera at LLNL (reused from Calta et al. [2019] under Creative Commons Attribution License [CC BY]). ME | AMNDEOVERVIEW 58 M A T E R I A L S E V A L U A T I O N • A P R I L 2 0 2 2
ASNT grants non-exclusive, non-transferable license of this material to  .
All rights reserved. © ASNT 2026. To report unauthorized use, contact: customersupport@asnt.org