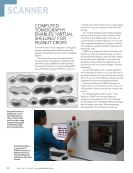
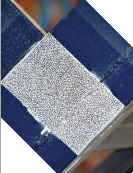
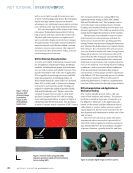
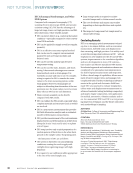
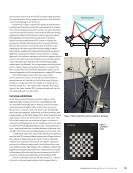
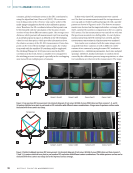
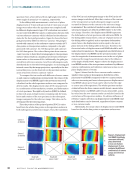
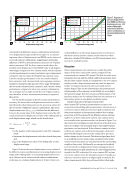
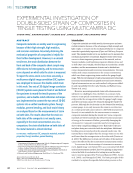
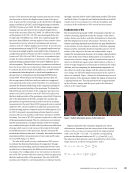
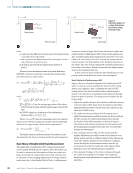
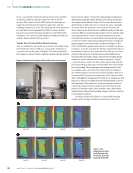
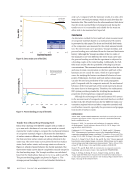
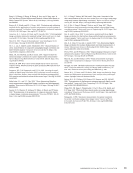
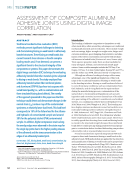
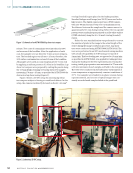
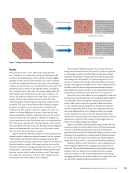
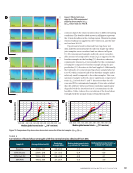
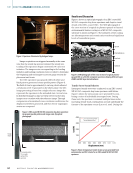
well as record split-second detonations or qua- si-static events lasting many hours. The technique, which uses high-speed cameras, has decisive advantages over traditional sensors and is evolving into a reliable point-and-shoot industrial solution. DIC was developed by Mike Sutton in the 1990s (Aerospace Testing International 2021). Sutton built a system with one camera that worked on a 2D plane and created pattern-recognition soft- ware to calculate displacements between images. Accurate fracture-test results convinced NASA to invest in Sutton’s work. He then added a second camera to create a stereo system. That captured movements in three dimensions. Today, tests can involve many pairs of cameras. DIC for Materials Characterization Accurate and reliable deformation measurements are a foundation of materials testing. Traditional methods, including strain gauges and extensome- ters, are both accurate and reliable however, they provide information only at the site of application. DIC is capable of producing noncontact full-field strain measurements of deforming bodies. At NASA Glenn Research Center (GRC) in Cleveland, Ohio, DIC is widely used to characterize damage in structures and materials and the findings are utilized to validate the analytical models (Abdul- Aziz and Wroblewski 2016). Figure 1 shows the variation of gauge section strain of a dog-bone specimen computed from DIC with increasing stress until specimen failure, as shown in Figure 2 (Abdul-Aziz and Wroblewski 2016). The specimen is made of ceramic matrix composite (CMC) coated with environmental barrier coating (EBC) that underwent tensile testing at NASA GRC (Abdul- Aziz and Wroblewski 2016). The technique can be used with many tests including torsion, thermal, bending, and combined loading for both static and dynamic applications. This study was used for strain energy-based fatigue life prediction of the material. The specimen was polished to remove surface defects and stress concentrations, and then the surfaces were cleaned before speckling and DIC testing. Strains were measured using the extensom- eter, whereas the displacement was captured using DIC software. The results from DIC and extensom- eter were found to match well. Strain energy-based fatigue life prediction curves produced from DIC proved that the DIC technique can substitute the extensometer. This demonstrates how strain and deformation in specimens with complicated geom- etry can be analyzed, even during dynamic loading conditions—and even in cases where traditional strain measurement techniques like using an extensometer or strain gauge would be experimen- tally difficult. DIC has repeatedly proven to validate finite element analysis (FEA) models used for predicting deformation. It offers a comprehensive overview of data extraction through image analysis. DIC Instrumentation and Application in Mechanical Testing DIC vendors typically provide end-to-end solu- tions in both hardware and software. The primary hardware is usually a stereo pair of cameras on a bar (Figure 3). They have to be aligned and cali- brated, so the system includes calibration objects, either plates or crosses. Earlier systems required expert alignment, but the trend currently is for the use of presets and automation to enable ease of use and accuracy. The newer 3D cameras are point-and-shoot instruments where users select a preset field of view (FOV) and templates for analysis and report- ing. After the first test, the user defines a number of points of interest, typically about 20, and then NDT TUTORIAL | OVERVIEWOFDIC Failure load gauge section Figure 1. Plot of the strain field of the last image frame before failure at 50% of the ultimate tensile stress. x y Figure 2. Ceramic matrix composite (CMC) dog-bone specimen coated with environmental barrier coating (EBC). Figure 3. Example digital image correlation system. 28 M AT E R I A L S E V A L U AT I O N • N O V E M B E R 2 0 2 2 CREDIT: DANTEC DYNAMICS

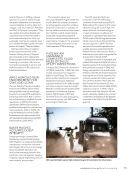
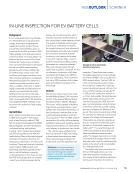
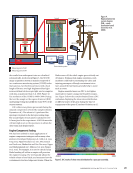
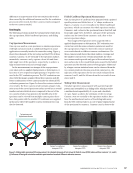
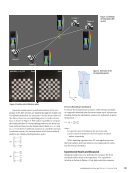
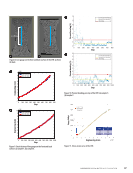
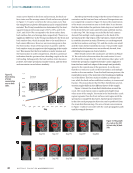
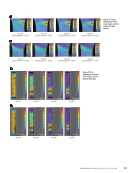
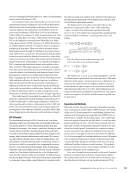
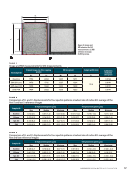
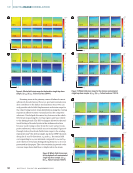
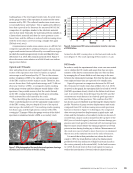
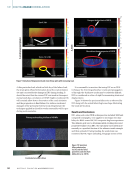
the results from subsequent tests are calculated automatically. As shown in Figure 3, the 3D-DIC image acquisition system is mainly composed of two continuous monitoring system (COMS) indus- trial cameras, two fixed-focus lenses with a focal length of 50 mm, two high-brightness blue-light sources without stroboscopic light, and a computer with data acquisition (Chai et al. 2020 Figure 4). The resolution of the COMS is 4096 × 3000. During the test, the sample or the region of interest (ROI) undergoing testing should fill the entire FOV of the camera system. DIC collects two photos per second during the uniaxial compression of rock-like samples (Dantec Dynamics n.d.). The subset is 19 pixels and the spacing is 16 pixels in the data processing stage. The actual length of each pixel is calculated to be 0.5 mm/pixel in the experiment. A ROI 40 mm wide × 80 mm high is set on the specimens to obtain the data strain and displacement. Engine Components Testing DIC has been utilized in many applications of engine components testing as well as many other products (Correlated Solutions n.d. Celli et al. 2019 Tong 2005 Mguil-Touchal et al. 1997 McCormick and Lord 2010 Shadmehri and Van Hoa 2019 Zappa and Hasheminejad 2017 Malesa et al. 2013 Ramos et al. 2015). For example, it is used to check if a fan blade breaking off within an engine will puncture the engine’s housing. The test basically allows the volatile release of one blade, and measures how the containment structure bulges and strains. When the blades come off, the whole engine goes violently out of balance. During actual engine operations, such incidents could lead to penetrating the cabin and injuring passengers, although containment struc- tures around the fan blades generally help to avoid such an event. Engine manufacturers use DIC to test lighter materials for engine casings, like braided compos- ites. Figure 5 shows the results obtained from a DIC evaluation displaying the shear stress distribution at different zones of the gear during the time of engagement of the gears (Correlated Solutions n.d.). –0.0035 0.002 Figure 5. DIC results of shear stress distribution for a spur gear assembly. MTS loading machine MTS C43 PC Data collection system Blue light source Sample 40 mm Measuring point of SLB-1 Measuring point of SLB-2 Right camera Left camera Tripod PC SLB-1 SLB-2 Survey line-2 Survey line-1 Figure 4. Representative test system diagram (SLB = strain localization band) (from Chai et al. 2020). N O V E M B E R 2 0 2 2 • M AT E R I A L S E V A L U AT I O N 29 80 mm
ASNT grants non-exclusive, non-transferable license of this material to  .
All rights reserved. © ASNT 2026. To report unauthorized use, contact: customersupport@asnt.org