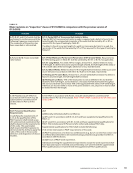
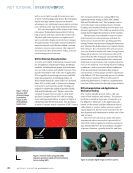
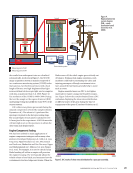
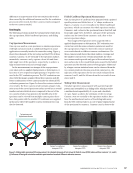
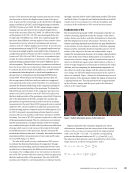
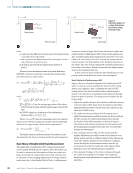
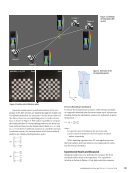
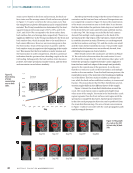
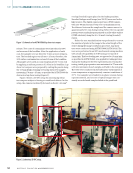
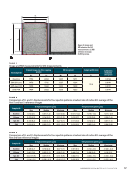
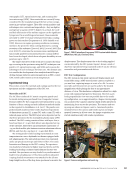
release. Two coats of contaminant were introduced at 50% surface area of the bondline. After the application of each coat, the samples were air dried for 15 min at room tempera- ture. The bonded region was 25 mm × 25 mm therefore, the 50% surface contamination covered 13 mm of the bondline. All samples were cured at room temperature (22 °C) for 24 h by applying a uniform pressure of 2.9 bar in the bondline. Lap shear test coupons were prepared by cutting the panels along the 178 mm height, forming several lap shear test samples measuring 178 mm × 25 mm, as specified by ASTM D5868 for destructive lap shear testing (Figure 1). Figure 2 shows a 2D DIC setup for assessing lap shear test coupons subject to kissing or weak bond defects. In this setup, the camera was directly focused on the 25 × 25 mm2 overlap (bonded) region placed in the loading machine. Standard halogen work lamps (two 500 W) were used as the light sources. The digital camera used was a DSLR camera with a 35-80 mm lens and f-stop of 5.6 at maximum zoom. The distance between the sample and the camera was set to approximately 311 mm during testing. Before the test, speckle patterns were randomly spray-painted on a flat white surface (CFRP substrate) along the 25 × 25 mm2 overlap (bonded) region. Before the test, standardization was performed to convert the number of pixels in the image to the actual length of the object during the image correlation processes. Lap shear tests were conducted using ASTM D5868 (ASTM 2014). The tests were performed in an MTS mechanical testing machine with a load cell capability of 25 KN using a test speed of 2 mm/min. This low loading rate, as opposed to 13 mm/min as specified in ASTM D5868, was applied for taking pictures during the loading for the DIC experimentation. During the testing, initial grip separation was maintained at 75 mm with a 25 mm minimum of each sample end held in the test grips. The tests were conducted in the laboratory environment at room temperature at approximately constant conditions of 22 °C. Test samples were loaded in in-plane tension during experimentation, and a series of optical images was con- stantly recorded until samples failed at the peak load. ME | DIGITALIMAGECORRELATION 2024 T3 25.4mm 25.4 mm Adhesive X Y Z CFRP 101.6 mm T3 AIAI 25.4 mm Figure 1. Schematic of an ASTM D5868 lap shear test coupon. PC Tripod MTS machine Light source Crosshead Camera Sample Figure 2. Laboratory 2D DIC setup. 54 M AT E R I A L S E V A L U AT I O N • N O V E M B E R 2 0 2 2

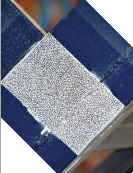
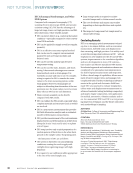
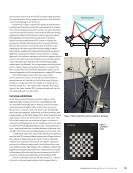
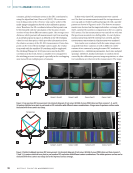
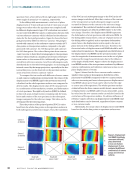
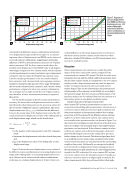
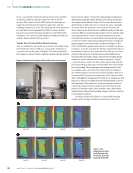
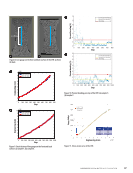
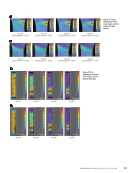
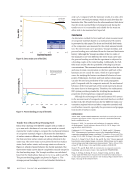
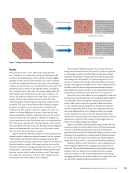
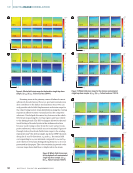
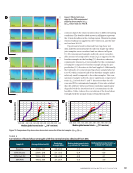
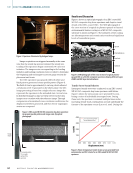
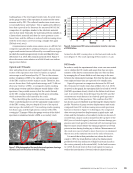
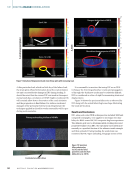
Results DIC measurements can be affected by many parame- ters. Therefore, it is essential to verify and determine the accuracy and performance of the software and the digital imaging system used for this research. As a rule of thumb, it is also recommended that two successive sets of images without any deformation be correlated first to determine the resolution and accuracy of the specific setup. In addition, due to system error and noise, the camera might have dif- ferent pixel value distributions at the same condition. To reduce the system’s random error and noise, 10 reference images (without any displacements) in the CFRP sub- strate along the overlap region in lap shear coupons were recorded. The first five and the last five reference images, as shown in Figure 3, were averaged for correlation. In addition, the first and last reference images were also cor- related to see the difference in errors. Based on the cali- bration during the software calibration process, the resolu- tion determined for the reference calibration sample was 0.01910 mm/pixel in the X-direction and 0.0191 mm/pixel in the Y-direction, respectively. Similarly, based on the resolu- tion calculated, the aspect ratio for the pixel on the digitized image was determined to be close to one (in other words, the size of the pixel was almost square). Figure 4 shows the baseline sample U- and V-displacement deviation plots (without any displacements) for the average of the first five and last five reference images and the first and last reference images, respectively. These were collected from the baseline sample. The image window size used for software verification was approximately 23.8 mm × 24.7 mm (1250 pixels × 1300 pixels). During the software verification process, various subset radius sizes were used. The results show that the convergence in the U- and V-displacements was obtained at subset radius of 35 or higher. The median U-displacement for the average reference image was determined to be 0.07 pixels (1.3 µm) as opposed to .05 pixels (1.0 µm) for the first and last reference images. Similarly, the median V-displacement for the average refer- ence image was –0.06 pixels (–1.2 µm) as opposed to –0.14 pixels (–2.6 µm) for the average of the first and last reference images. Although theoretically, the U- and V- displacements should be zero for the no-displacement reference images, these slight deviations were due to the experimental, instru- mentation, and software errors that were to be expected. Since there were four different sets of samples considered for this study, speckle patterns were randomly spray-painted on a flat white surface along the overlap (bonded) region in the CFRP surface and were applied at different instanc- es. Also, during testing, samples were loaded into the MTS machine separately, and in some cases, lighting conditions also varied during these tests. All these factors can signifi- cantly contribute to errors in the DIC measurement. Stan- dardization was performed as described previously to ensure maximum accuracy for the testing to help compensate for these errors before testing each sample. Figure 5 and Table 1 provide details on the image size cap- tured and region of interest (ROI) sizes for DIC measurements. It is to be noted that speckle pattern density and their histo- gram distributions varied in all speckle images, and this can be attributed to the application of spray paint in different instanc- es. For all cases, the aspect ratio for the pixel on the digitized image was close to one (i.e., the pixel size was almost square). Similarly, Tables 2 and 3 show the U- and V-displacements for four speckle patterns (four samples) at a subset size of radius 40. The median displacements calculated for the first and last reference image sets are higher than the average reference image sets. The results obtained prove that image averaging can reduce the system random error and noise and can get better displacement measurements in DIC. Figure 3. Image averaging approach for the reference images. First 5 reference images Average of first 5 images Average of last 5 images Last 5 reference images N O V E M B E R 2 0 2 2 • M AT E R I A L S E V A L U AT I O N 55
ASNT grants non-exclusive, non-transferable license of this material to  .
All rights reserved. © ASNT 2026. To report unauthorized use, contact: customersupport@asnt.org