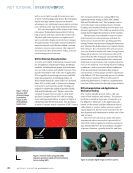
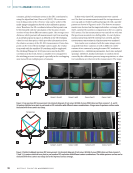
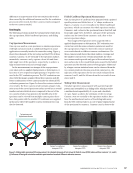
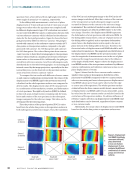
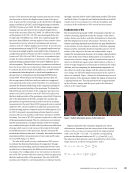
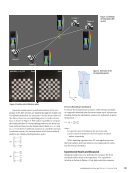
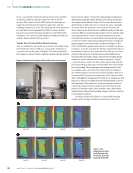
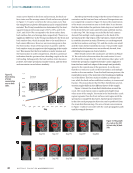
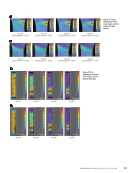
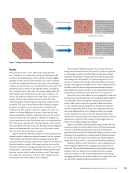
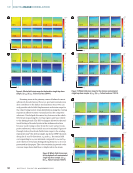
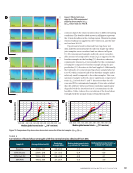
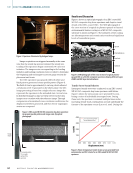
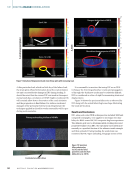
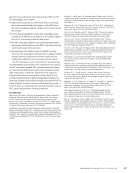
Shearing stress is the primary cause of failure for most adhesively bonded joints. However, peel and normal stress also contribute to the failure mechanisms. Since DIC can only provide whole-field displacement and strain maps for the object being tested, strain distribution along the overlap regions in adhesive joints was analyzed in the composite substrate. This helped determine key features in the whole- field strain map along the overlap regions and was related to the kissing bonds. The DIC technique allows for the real- world testing of bonded joints in the airframe structure because such testing is done from the outer surface (com- posite substrate), where inside access is minimal. Figures 6 through 9 show the whole-field strain maps in the overlap region (25 mm2) for all four single-lap shear CFRP-Al joints along the X- and Y-directions, εxx and εyy. The strain field corresponding to εxy was minimal compared to εxx and εyy, and it did not reveal any distinguishing features, so it is not presented in this paper. The color variation in pseudo color contour maps from dark blue to bright red in the strain 100 N 192 N 361 N 655 N 915 N 1238 N 1509 N 1732 N 1950 N 2197 N 2417 N 2627 N 2787 N 2959 N 100 N 192 N 361 N 655 N 915 N 1238 N x 10 -3 1509 N 1732 N 1950 N 2197 N 2417 N 2627 N 2787 N 2959 N Y X Y X 3 2 1 0 –1 –2 –3 –4 –5 x 10 -3 3 2 1 0 –1 –2 –3 –4 –5 Figure 6. Whole-field strain maps for the baseline single-lap shear sample: (a) εyy (b) εxx. Failure load was 3044 N. 132 N 356 N 623 N 966 N 1269 N 1525 N 1767 N 1976 N 2138 N 2296 N 132 N 356 N 623 N 966 N 1269 N x 10 -3 1525 N 1767 N 1976 N 2138 N 2296 N Y X Y X 3 2 1 0 –1 –2 –3 –4 –5 x 10 -3 3 2 1 0 –1 –2 –3 –4 –5 Figure 7. Whole-field strain maps for the silicone contaminated single-lap shear sample: (a) εyy (b) εxx. Failure load was 2383 N. ME | DIGITALIMAGECORRELATION 107 N 233 N 386 N 542 N 754 N 987 N 1191 N 1334 N 107 N 233 N 386 N 542 N 754 N 987 N 1191 N 1334 N Y X Y X x 10 -3 3 2 1 0 –1 –2 –3 –4 –5 x 10 -3 3 2 1 0 –1 –2 –3 –4 –5 Figure 8. Whole-field strain maps for the hydraulic oil contaminated single-lap shear sample: (a) εyy (b) εxx. Failure load was 1553 N. 58 M AT E R I A L S E V A L U AT I O N • N O V E M B E R 2 0 2 2

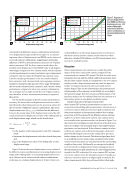
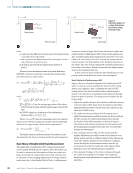
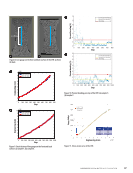
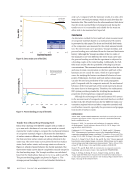
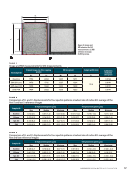
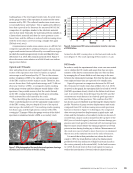
contours depicts the strain variations due to different loading conditions. The double-sided arrows in all figures represent the 13 mm bondline in the overlap region. Uniaxial in-plane tension loading was applied in the Y-direction, and the fail- ure load was 3044 N. Experimental results obtained from lap shear test data and DIC measurements for all four single-lap shear joint samples were correlated and are shown in Figure 10. All contaminated samples suffered a more consider- able amount of compressive strain (εyy) as opposed to the baseline samples in the loading (Y-) direction, whereas compressive strains (εxx) were smaller for the contaminat- ed samples compared to baseline sample along the per- pendicular (X-) direction to the load applied. Additionally, the hydraulic oil contaminated lap shear sample failed at 1553 N, which is almost half of the baseline sample and is relatively small compared to the other samples. This con- taminated sample suffered a more significant compressive strain (εyy) in both the X- and Y- directions than the sili- cone and PVA-contaminated samples. It was also evident that the adhesive shear and elastic modulus significantly degraded with the introduction of a contaminant in the bondline. Table 4 shows the correlation of the bond shear strength with the normal strains obtained from DIC. 116 N 341 N 580 N 821 N 994 N 1170 N 1786 N 1922 N 1421 N 1621 N 116 N 341 N 580 N 821 N 994 N 1170 N 1786 N 1922 N 1421 N 1621 N Y X Y X x 10 -3 3 2 1 0 –1 –2 –3 –4 –5 x 10 -3 3 2 1 0 –1 –2 –3 –4 –5 Figure 9. Whole-field strain maps for the PVA contaminated single-lap shear sample: (a) εyy (b) εxx. Failure load was 1966 N. 5.0 4.5 4.0 3.5 3.0 2.5 2.0 1.5 1.0 0.5 0.0 0.00 –0.50 –1.00 –1.50 –2.00 –2.50 –3.00 –3.50 –4.00 –4.50 –5.00 Baseline Silicone Hydraulic oil PVA Baseline Silicone Hydraulic oil PVA Median global normal strain - εxx (10-3 mm/mm) 5.0 4.5 4.0 3.5 3.0 2.5 2.0 1.5 1.0 0.5 0.0 0.50 0.00 –0.50 –1.00 –1.50 –2.00 –2.50 –3.00 –3.50 –4.00 –4.50 –5.00 Median global normal strain - εyy (10-3 mm/mm) Figure 10. Comparison of lap shear stress-shear strain curves for all four test samples: (a) εyy (b) εxx. TA B L E 4 Correlation of bond shear strength with the normal strains obtained from DIC Sample ID Average failure load (N) Bond shear strength (MPa) Median global normal strain (εyy) at break (10–3 mm/mm) Median global normal strain (εxx) at break (10–3 mm/mm) Baseline 3110 ± 141 4.8 ± 0.2 –1.2 –4.4 50% Silicone 2359 ± 218 3.7 ± 0.3 –2.4 –3.0 50% Hyd. Oil 1555 ± 278 2.4 ± 0.4 –2.8 –3.1 50% PVA 1966 ± 260 3.1 ± 0.4 –2.6 –3.0 N O V E M B E R 2 0 2 2 • M AT E R I A L S E V A L U AT I O N 59 Bond shear stress (MPa) Bond shear stress (MPa)
ASNT grants non-exclusive, non-transferable license of this material to  .
All rights reserved. © ASNT 2026. To report unauthorized use, contact: customersupport@asnt.org